Players 2020 final


Tight ends — 2020 · ranked by Rec yards
| # | Player | Tm | G | Grade | Yds/gm | Rec/gm | Tgt/gm | Rec yds | Rec | TD | Y/R | Catch% | Tgt share | WOPR |
|---|---|---|---|---|---|---|---|---|---|---|---|---|---|---|
| 1 |
Travis Kelce
|
KC | 15 | 88 | 94.4 | 7.0 | 9.7 | 105 | 11 | 13.5 | 72.4% | 24.6% | 0.54 | |
| 2 |
Darren Waller
|
LV | 16 | 82 | 74.8 | 6.7 | 9.1 | 107 | 9 | 11.2 | 73.8% | 27.8% | 0.59 | |
| 3 |
T.J. Hockenson
|
DET | 16 | 72 | 45.2 | 4.2 | 6.3 | 67 | 6 | 10.8 | 66.3% | 17.8% | 0.37 | |
| 4 |
Mike Gesicki
|
MIA | 15 | 71 | 46.9 | 3.5 | 5.7 | 53 | 6 | 13.3 | 62.4% | 16.2% | 0.41 | |
| 5 |
Mark Andrews
|
BAL | 14 | 76 | 50.1 | 4.1 | 6.3 | 58 | 7 | 12.1 | 65.9% | 24.9% | 0.56 | |
| 6 |
 Noah Fant
|
DEN | 14 | 69 | 48.1 | 4.4 | 6.6 | 62 | 3 | 10.9 | 66.7% | 20.1% | 0.42 | |
| 7 |
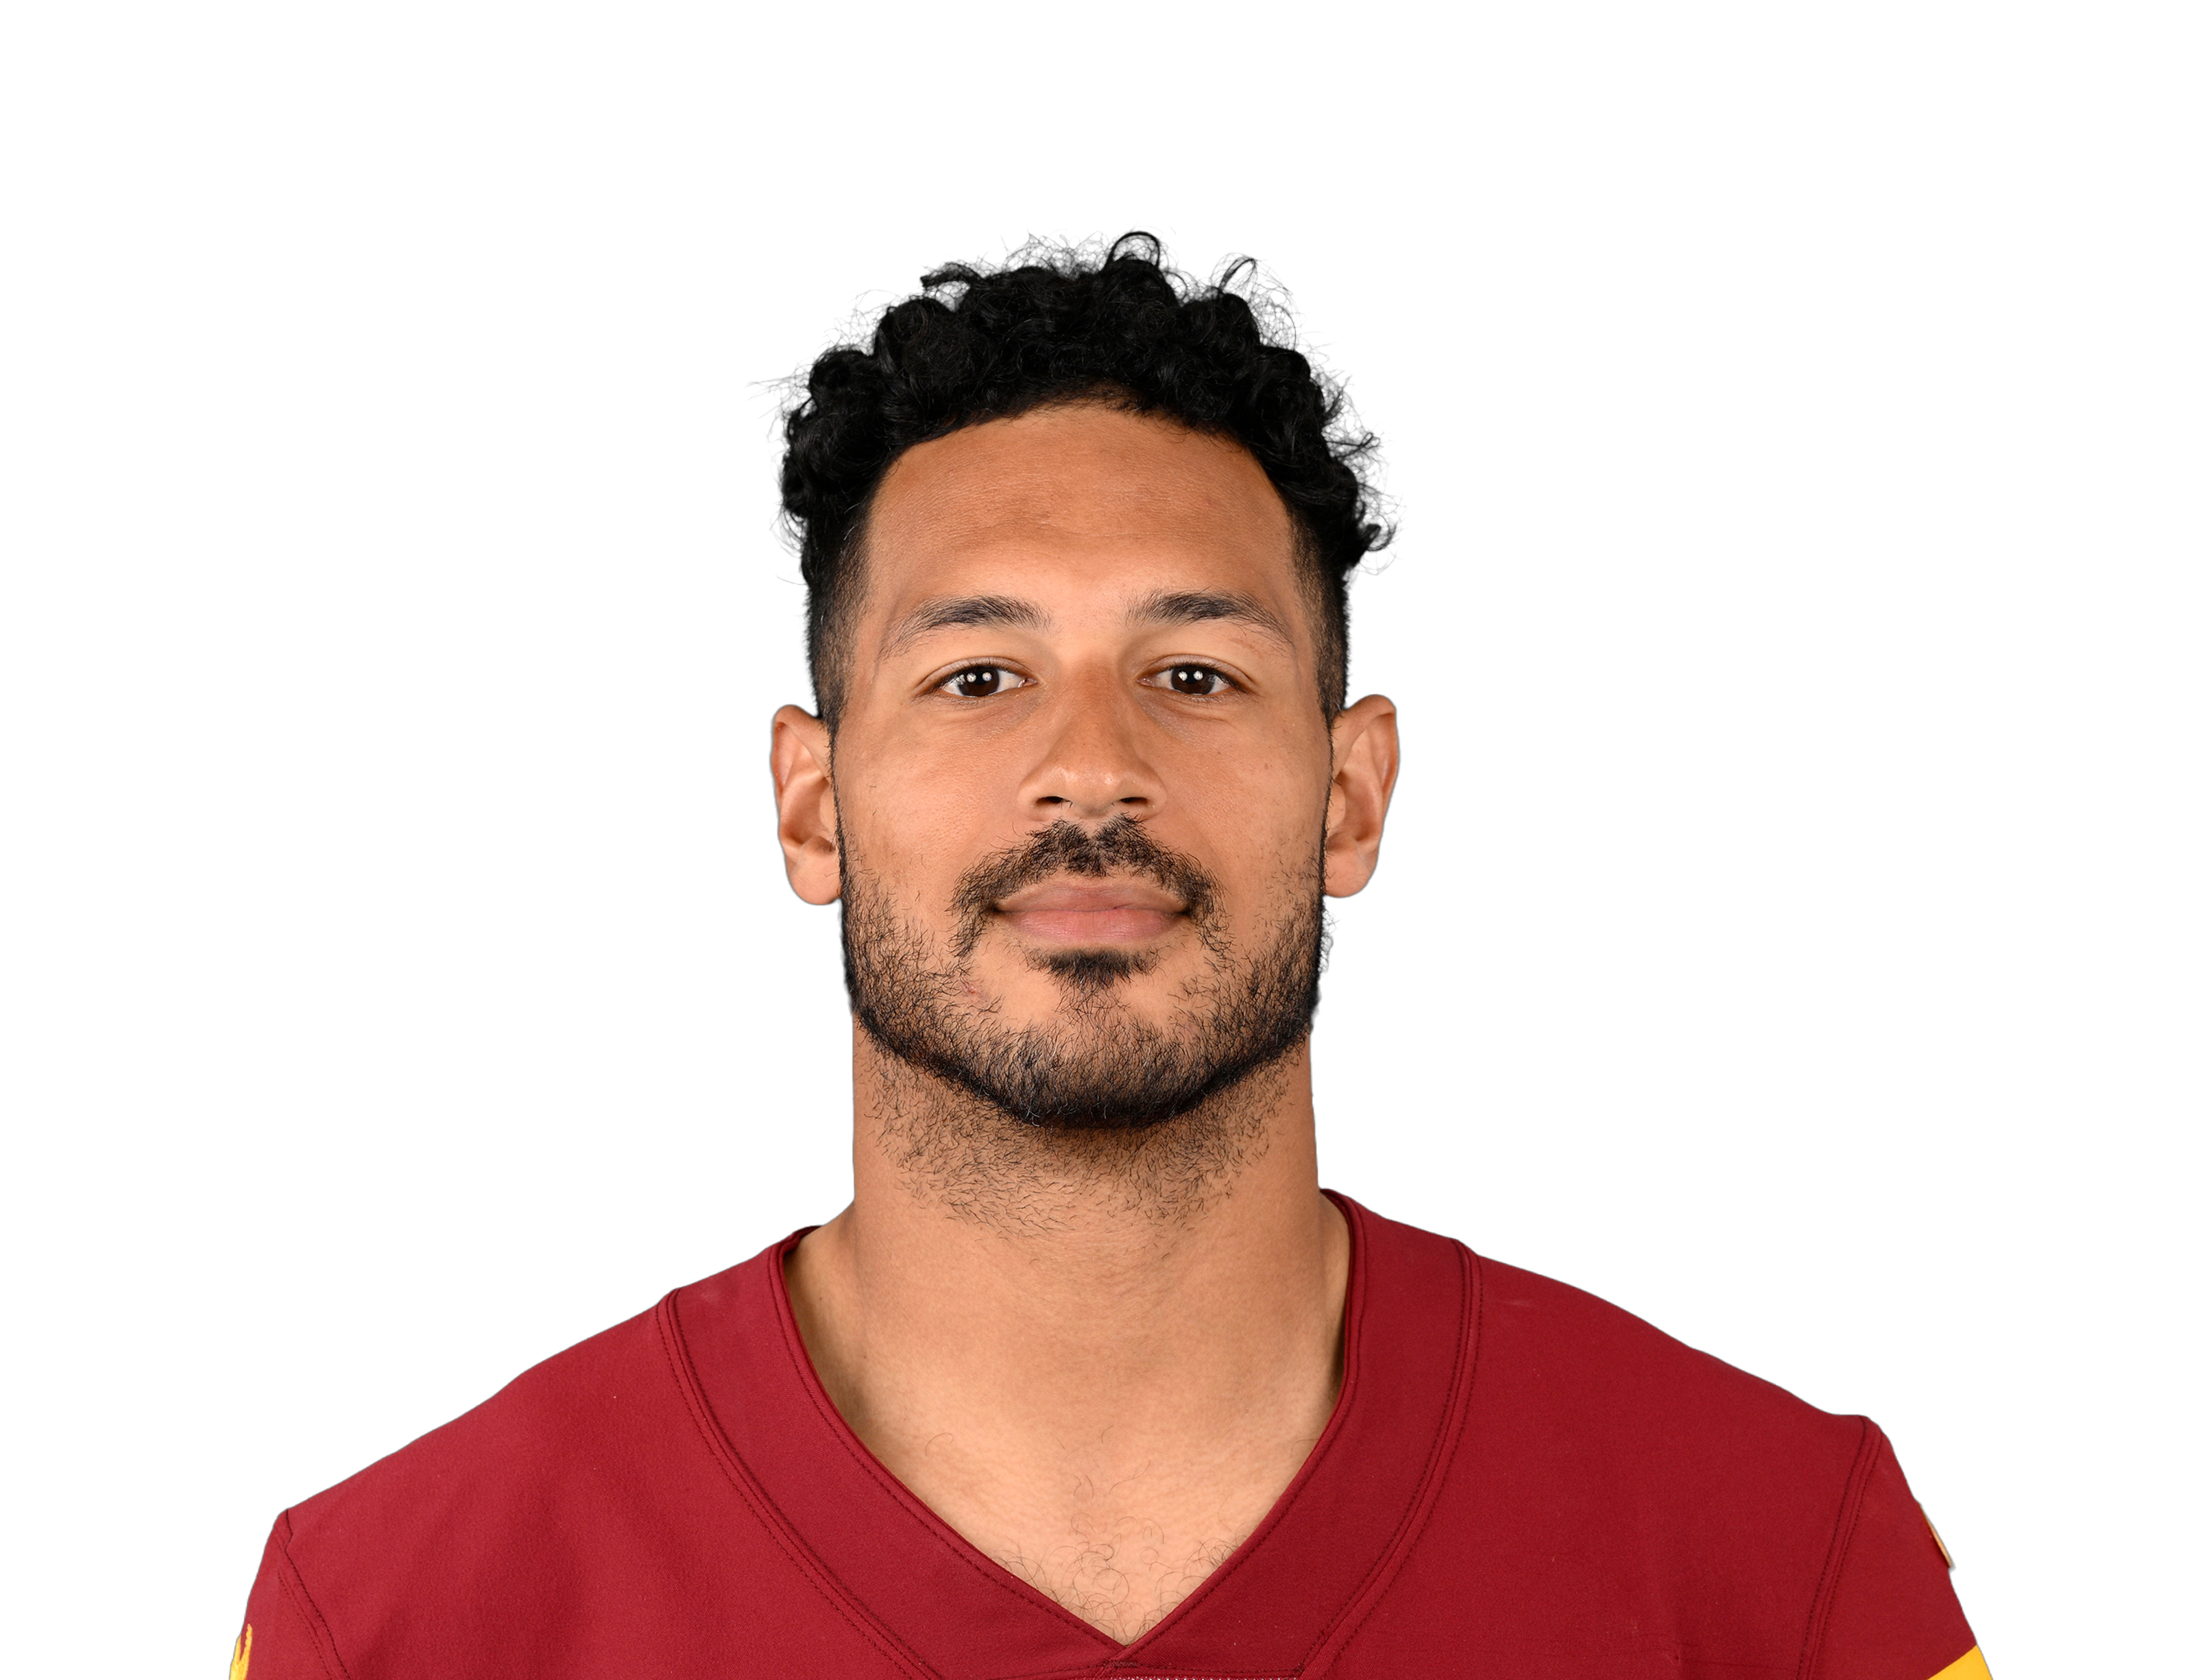 Logan Thomas
|
WAS | 16 | 75 | 41.9 | 4.5 | 6.9 | 72 | 6 | 9.3 | 65.5% | 19.3% | 0.43 | |
| 8 |
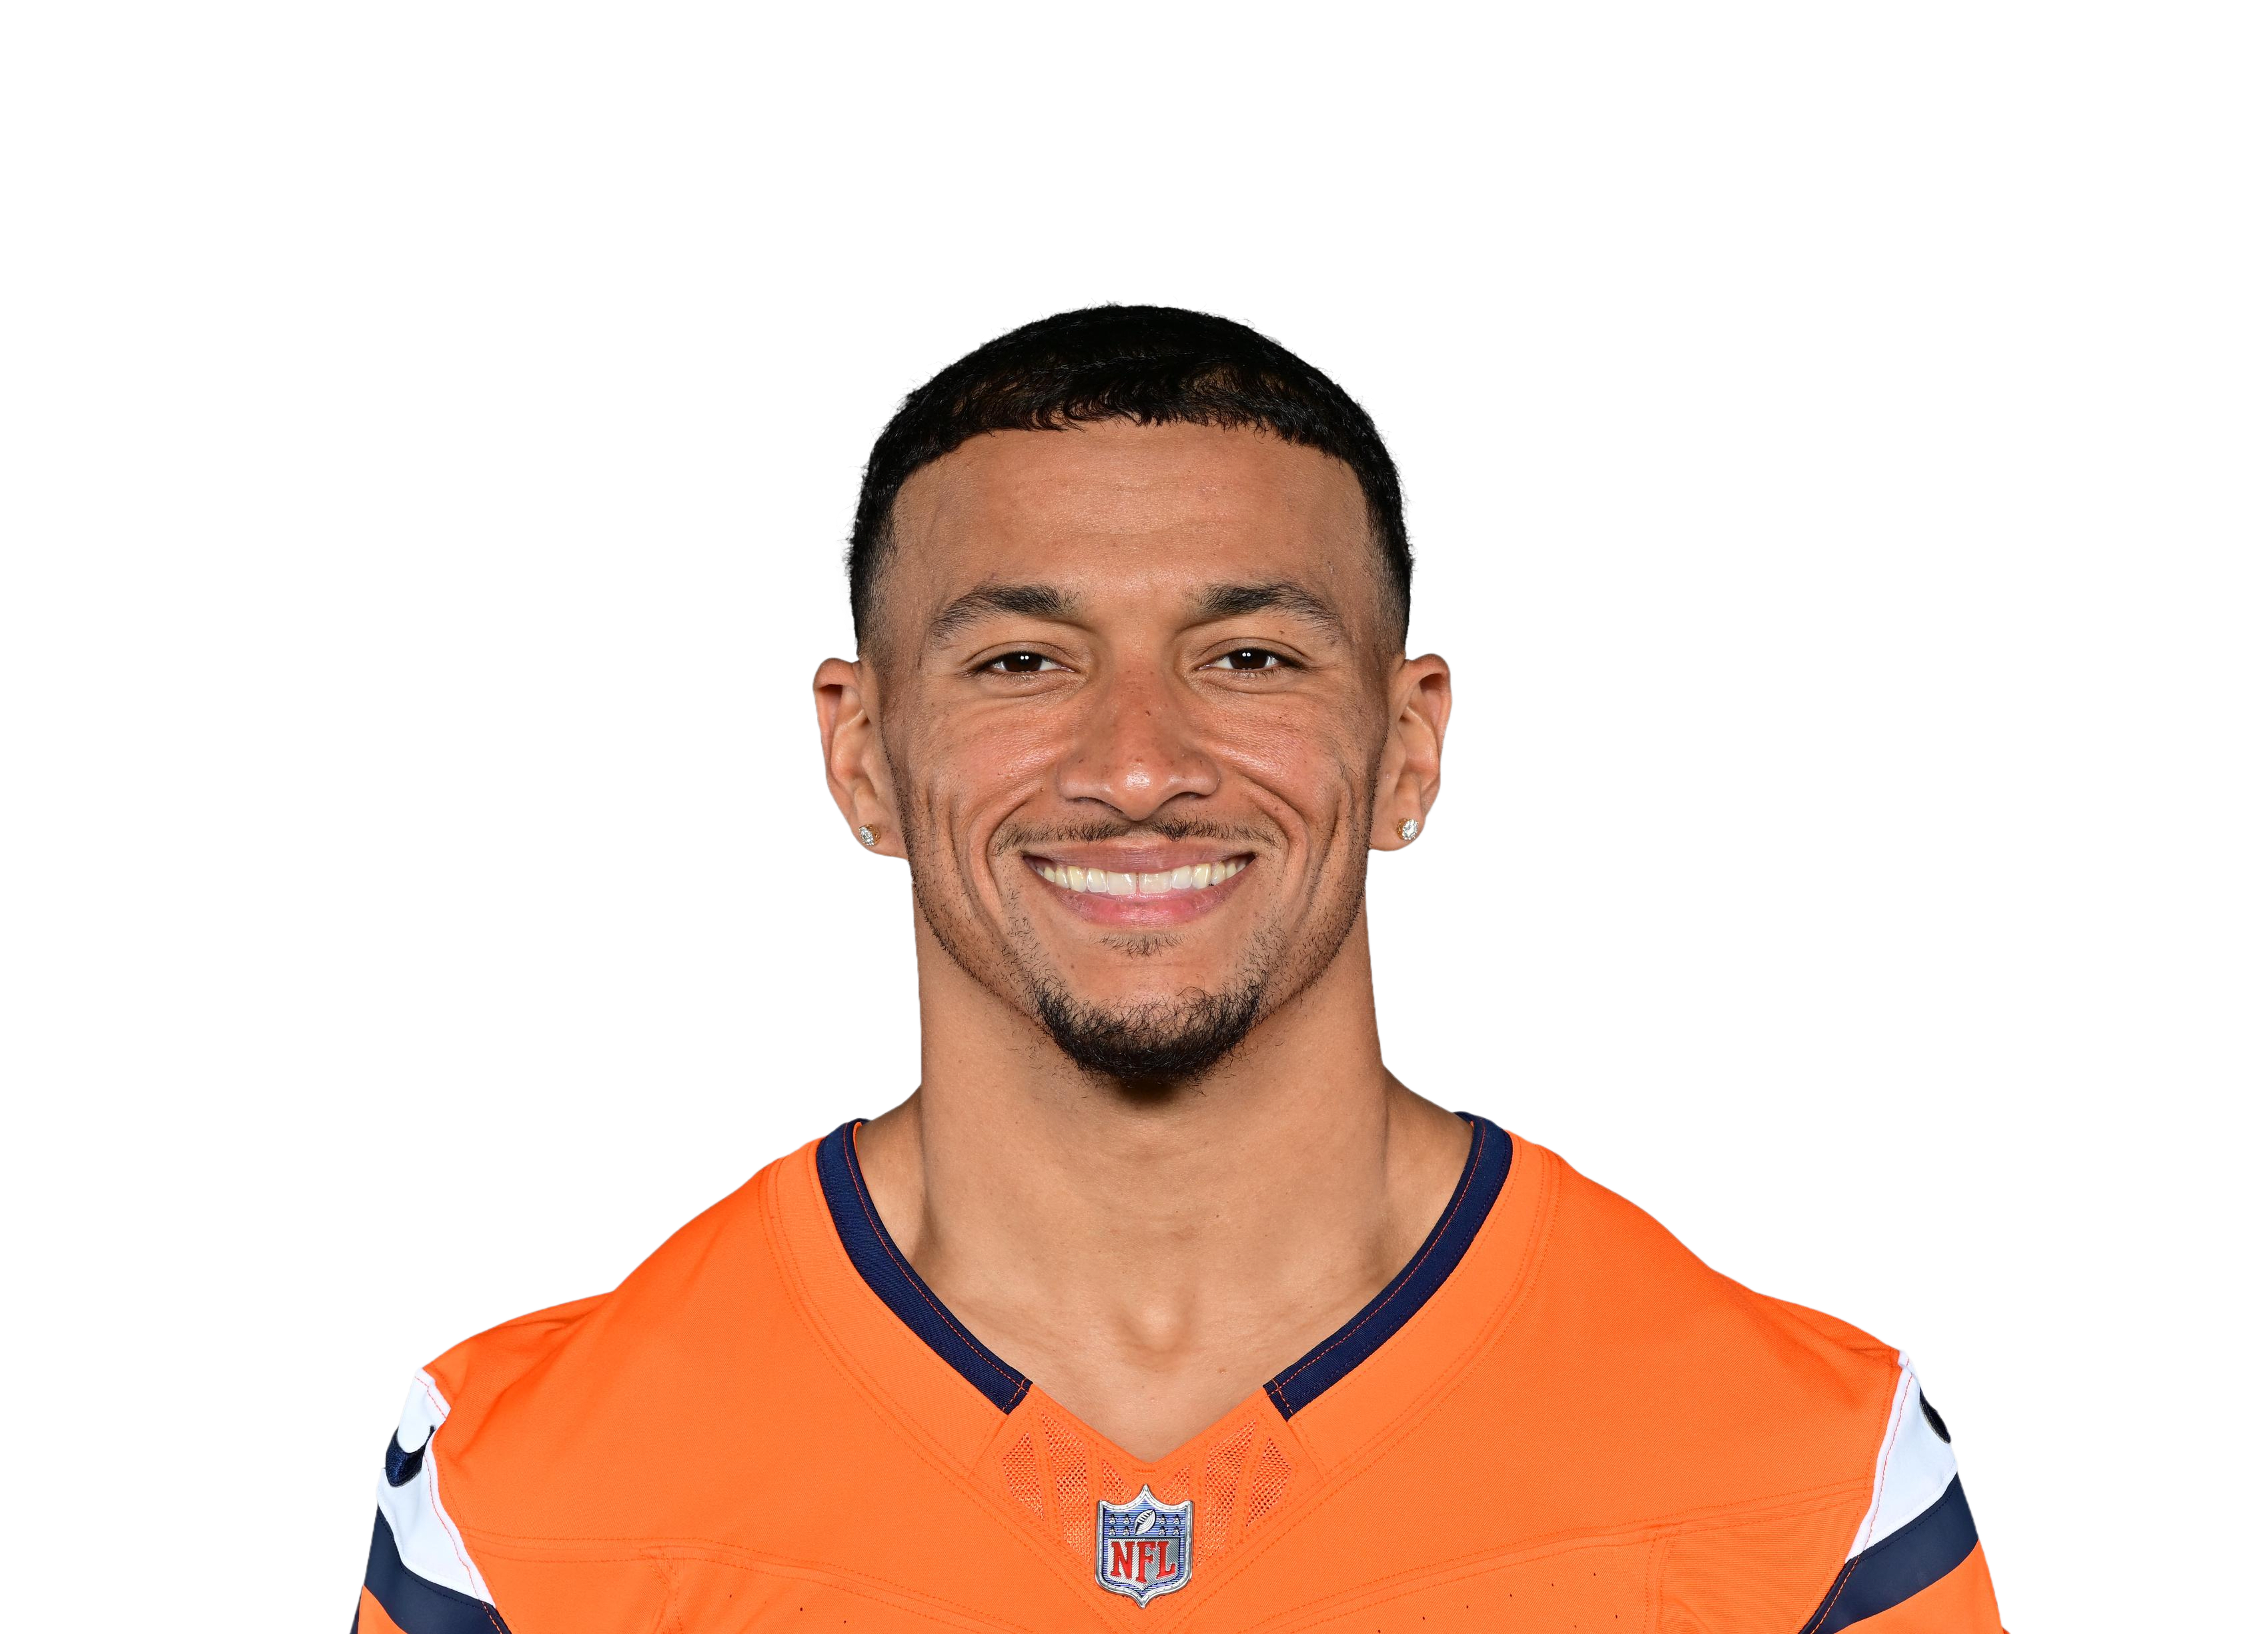 Evan Engram
|
NYG | 16 | 63 | 40.9 | 3.9 | 6.8 | 63 | 1 | 10.4 | 57.8% | 21.6% | 0.46 | |
| 9 |
 George Kittle
|
SF | 8 | 79 | 79.2 | 6.0 | 7.9 | 48 | 2 | 13.2 | 76.2% | 24.2% | 0.55 | |
| 10 |
 Rob Gronkowski
|
TB | 16 | 65 | 38.9 | 2.8 | 4.8 | 45 | 7 | 13.8 | 58.4% | 12.9% | 0.30 | |
| 11 |
 Dalton Schultz
|
DAL | 16 | 65 | 38.4 | 3.9 | 5.6 | 63 | 4 | 9.8 | 70.8% | 14.6% | 0.30 | |
| 12 |
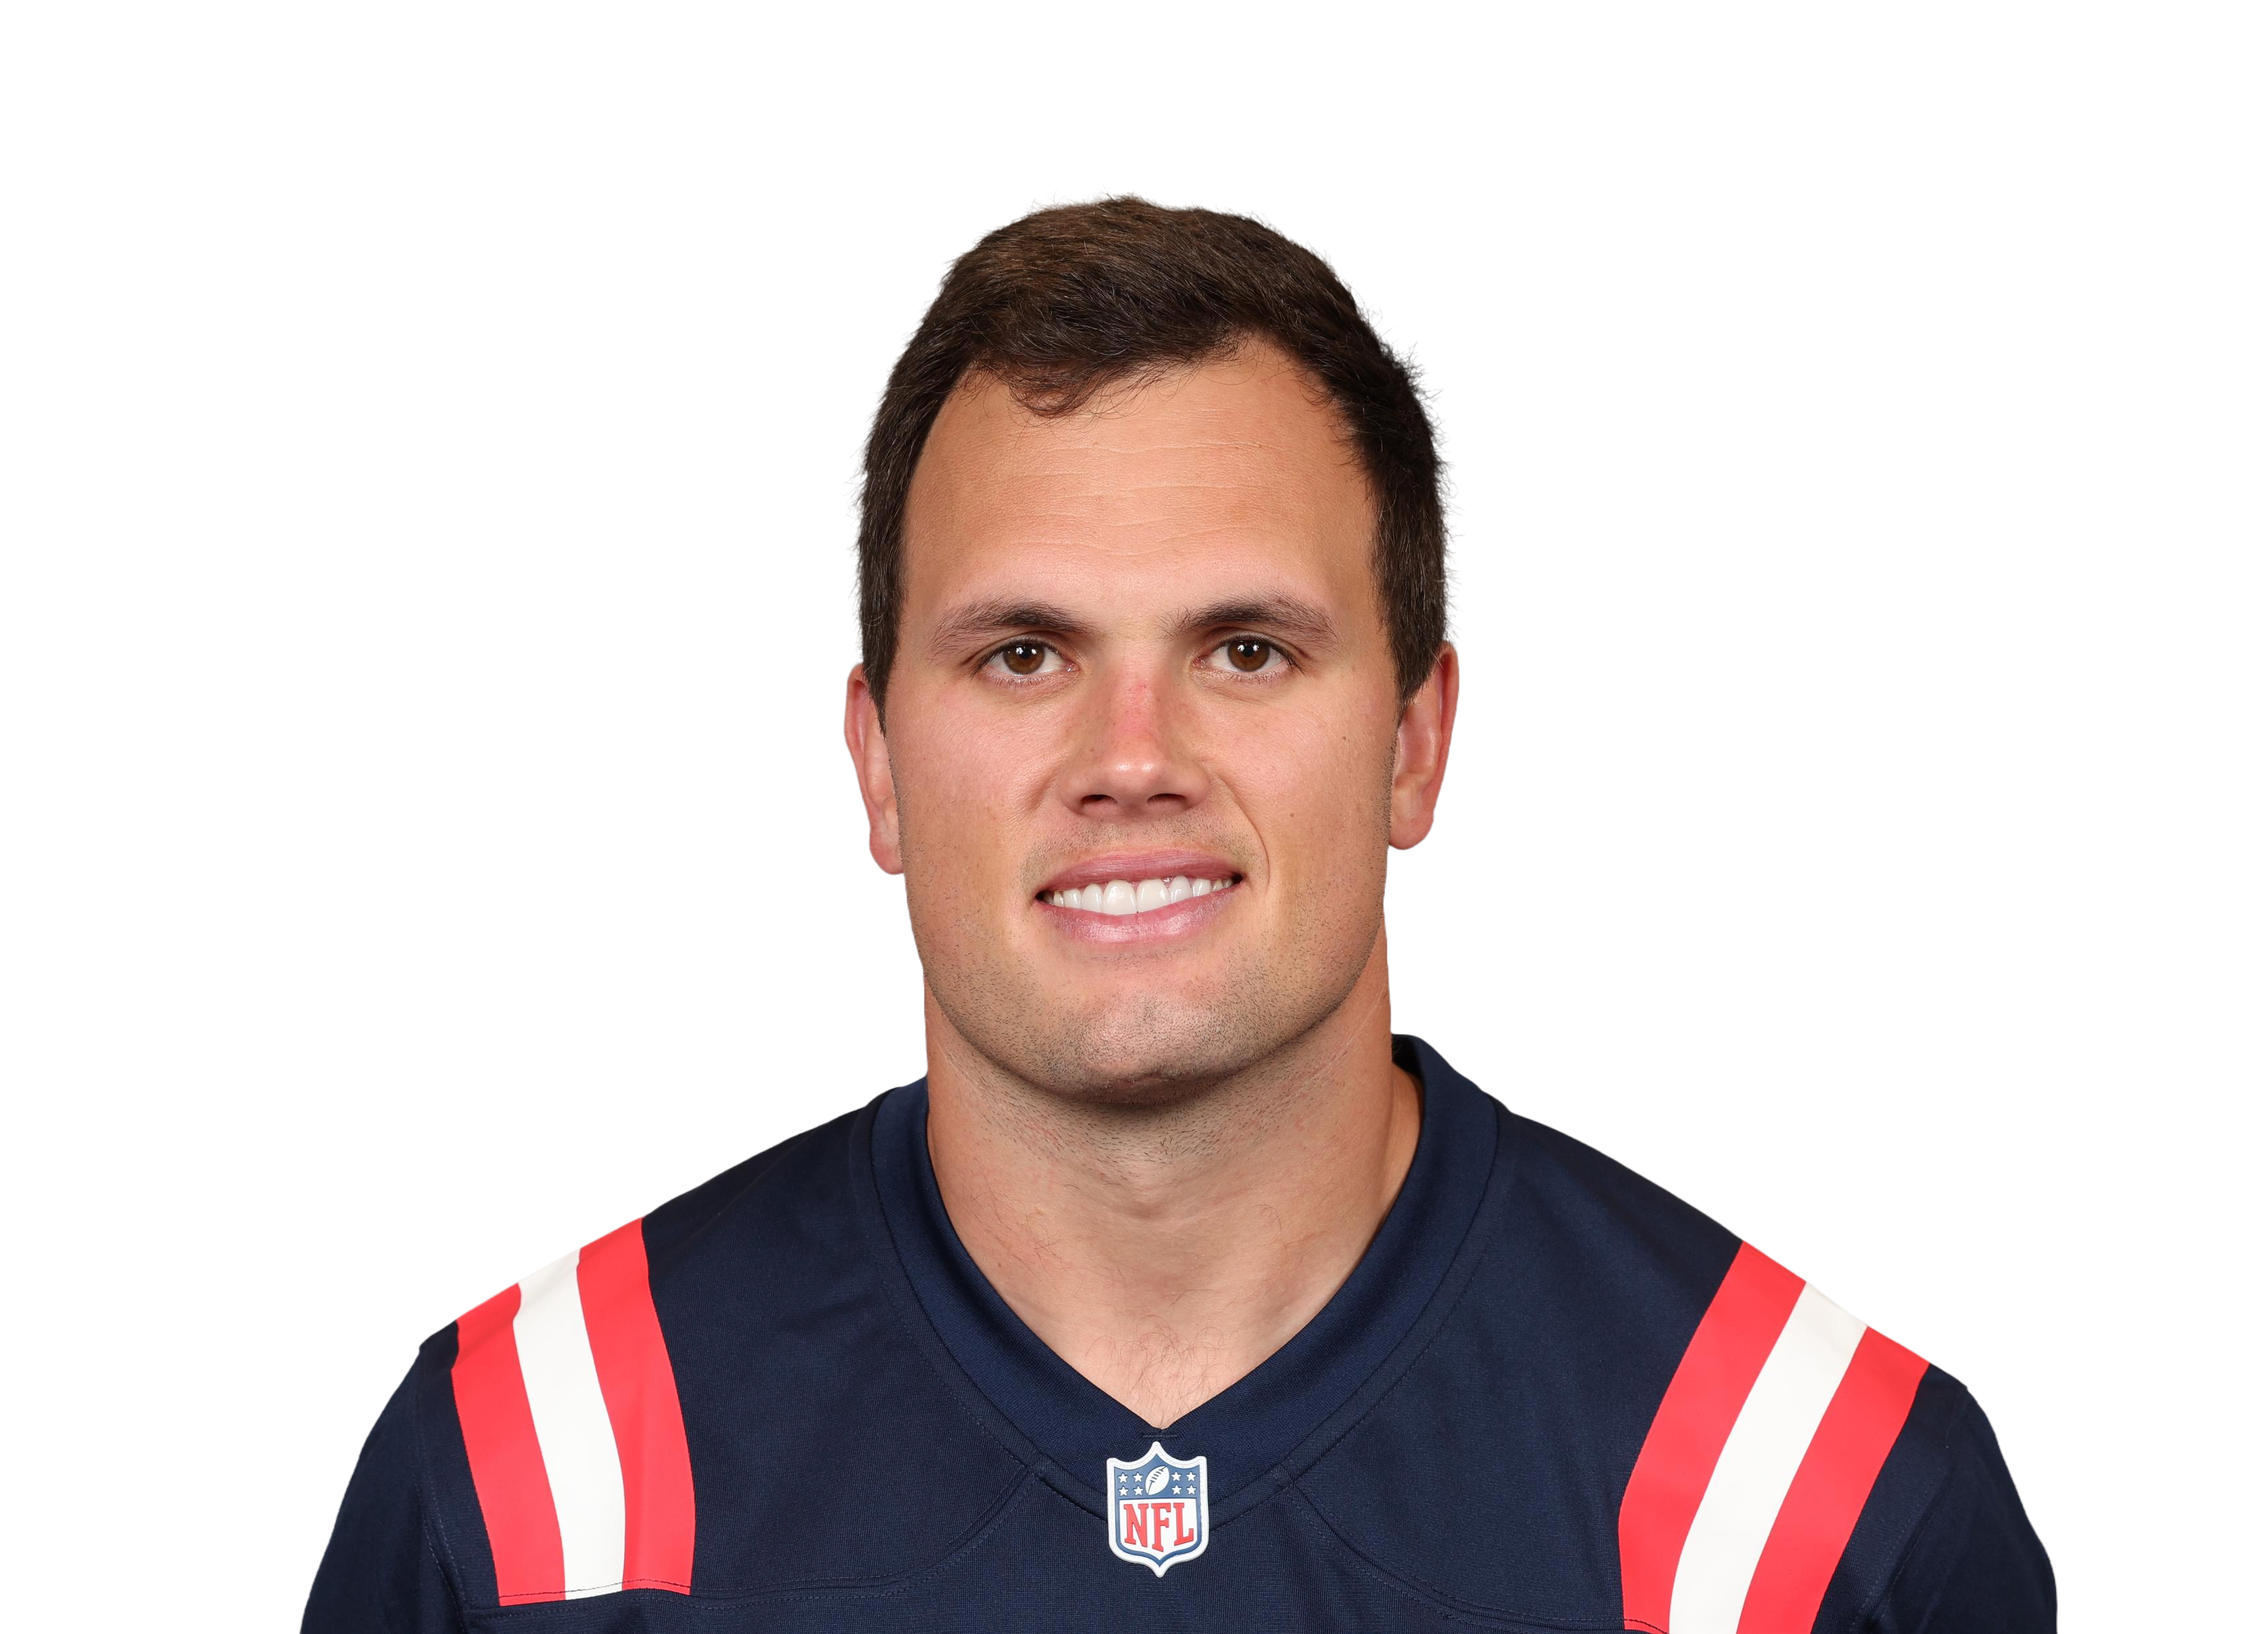 Hunter Henry
|
LAC | 14 | 68 | 43.8 | 4.3 | 6.6 | 60 | 4 | 10.2 | 64.5% | 17.9% | 0.39 | |
| 13 |
 Robert Tonyan
|
GB | 15 | 73 | 39.1 | 3.5 | 3.9 | 52 | 11 | 11.3 | 88.1% | 12.6% | 0.27 | |
| 14 |
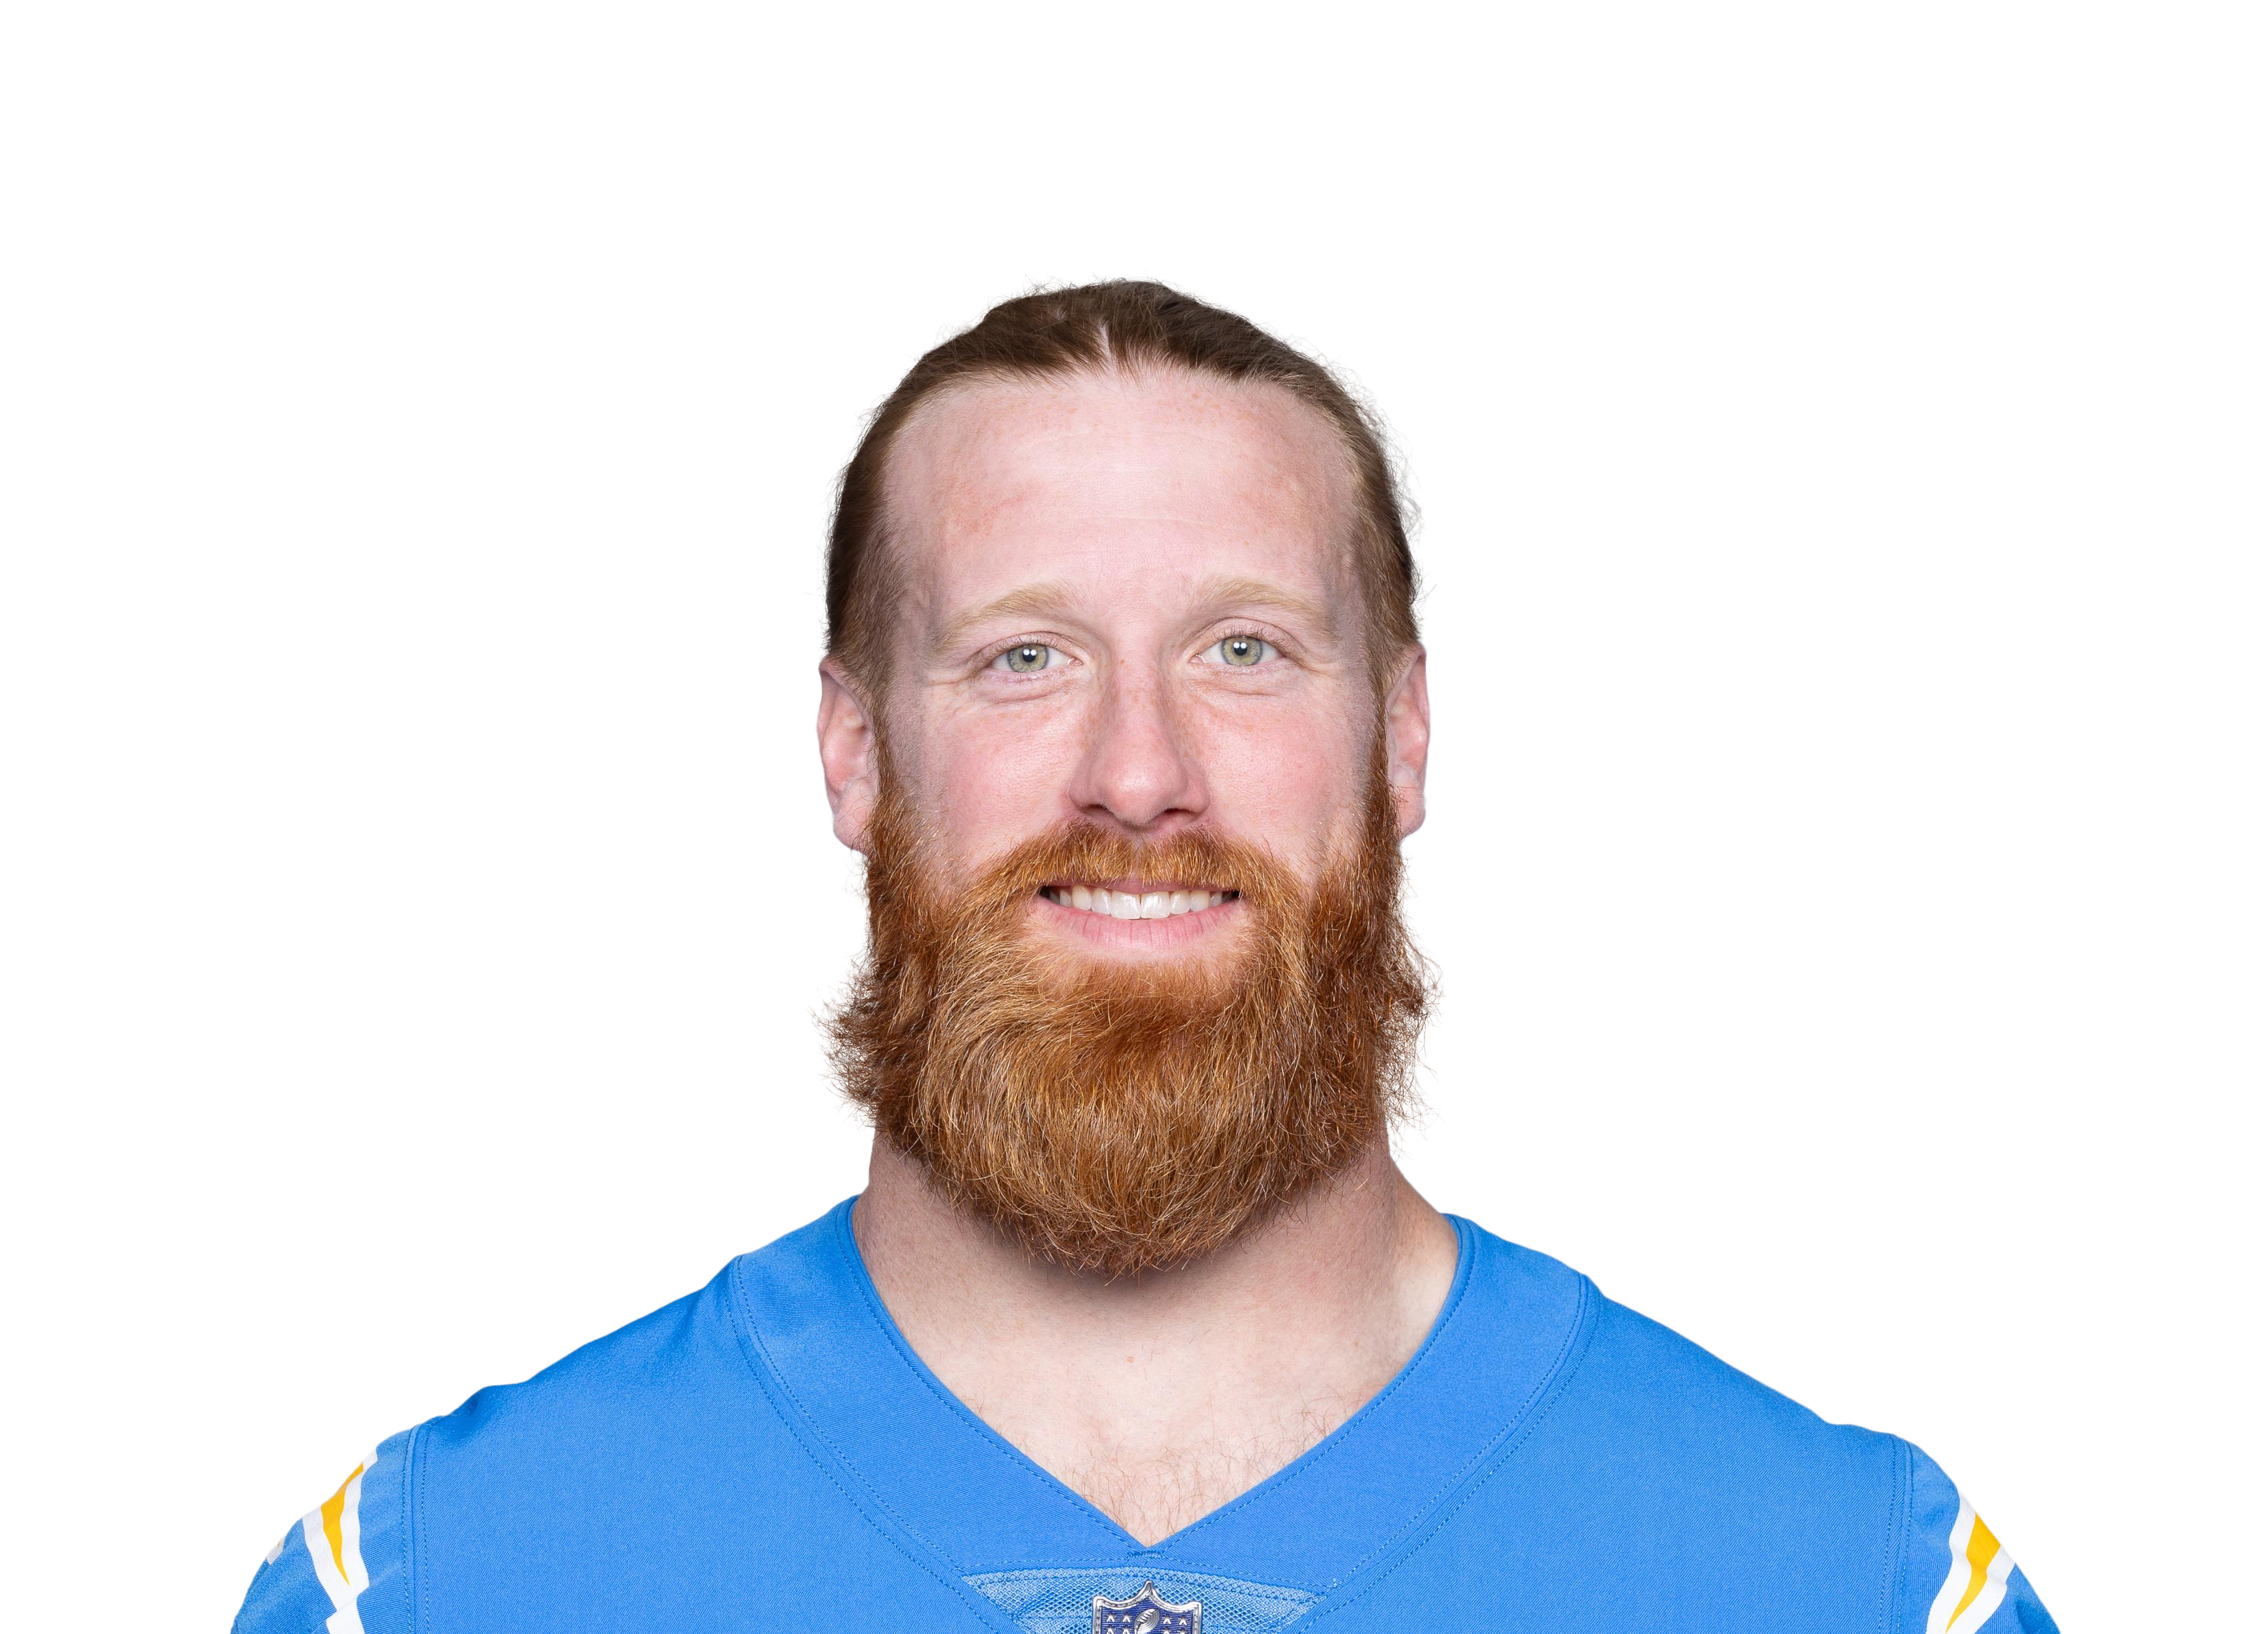 Hayden Hurst
|
ATL | 16 | 64 | 35.7 | 3.5 | 5.5 | 56 | 6 | 10.2 | 63.6% | 14.8% | 0.30 | |
| 15 |
 Eric Ebron
|
PIT | 15 | 67 | 37.2 | 3.7 | 6.1 | 56 | 5 | 10.0 | 61.5% | 14.7% | 0.33 | |
| 16 |
 Dallas Goedert
|
PHI | 11 | 70 | 47.6 | 4.2 | 5.9 | 46 | 3 | 11.4 | 70.8% | 16.8% | 0.36 | |
| 17 |
 Tyler Higbee
|
LAR | 15 | 61 | 34.7 | 2.9 | 4.0 | 44 | 5 | 11.8 | 73.3% | 11.5% | 0.27 | |
| 18 |
 Jared Cook
|
NO | 15 | 62 | 33.6 | 2.5 | 4.0 | 37 | 7 | 13.6 | 61.7% | 12.5% | 0.35 | |
| 19 |
 Jimmy Graham
|
CHI | 16 | 62 | 28.5 | 3.1 | 4.8 | 50 | 8 | 9.1 | 65.8% | 12.5% | 0.26 | |
| 20 |
 Jonnu Smith
|
TEN | 14 | 66 | 32.0 | 2.9 | 4.6 | 41 | 8 | 10.9 | 63.1% | 16.2% | 0.32 | |
| 21 |
 Dan Arnold
|
ARI | 15 | 58 | 29.2 | 2.1 | 3.0 | 31 | 4 | 14.1 | 68.9% | 8.6% | 0.22 | |
| 22 |
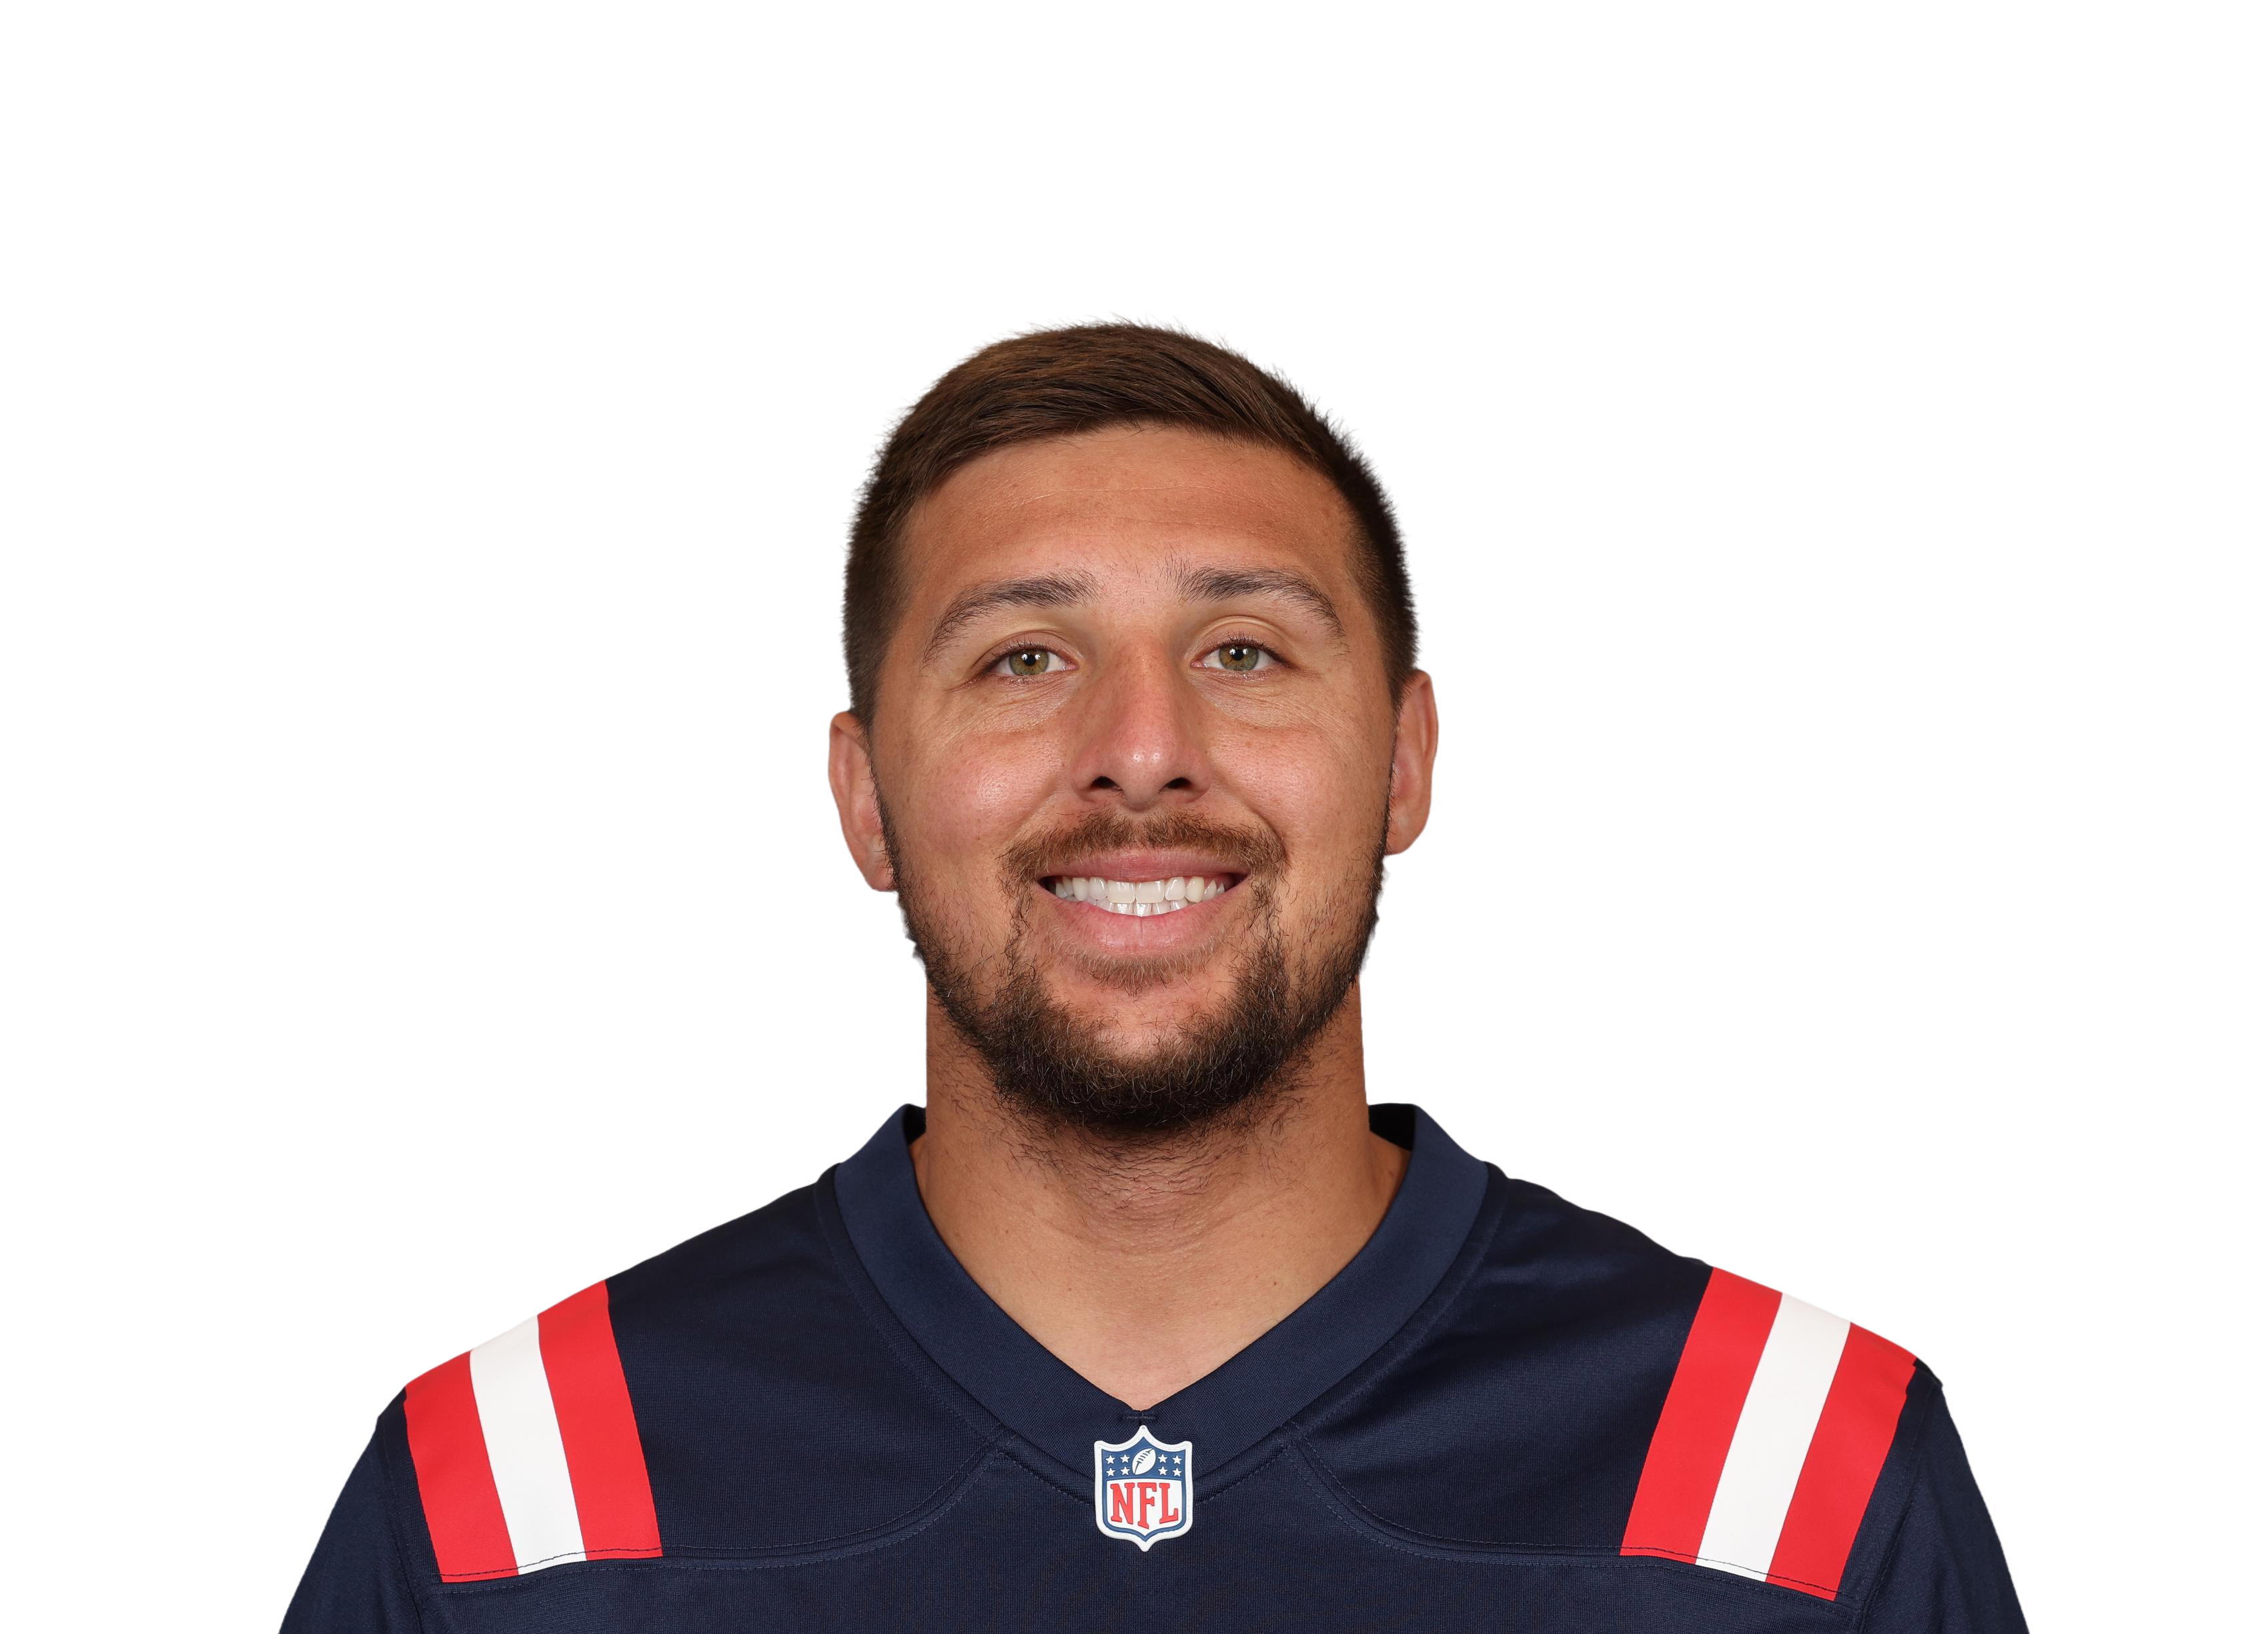 Austin Hooper
|
CLE | 13 | 63 | 33.5 | 3.5 | 5.4 | 46 | 4 | 9.5 | 65.7% | 18.5% | 0.36 | |
| 23 |
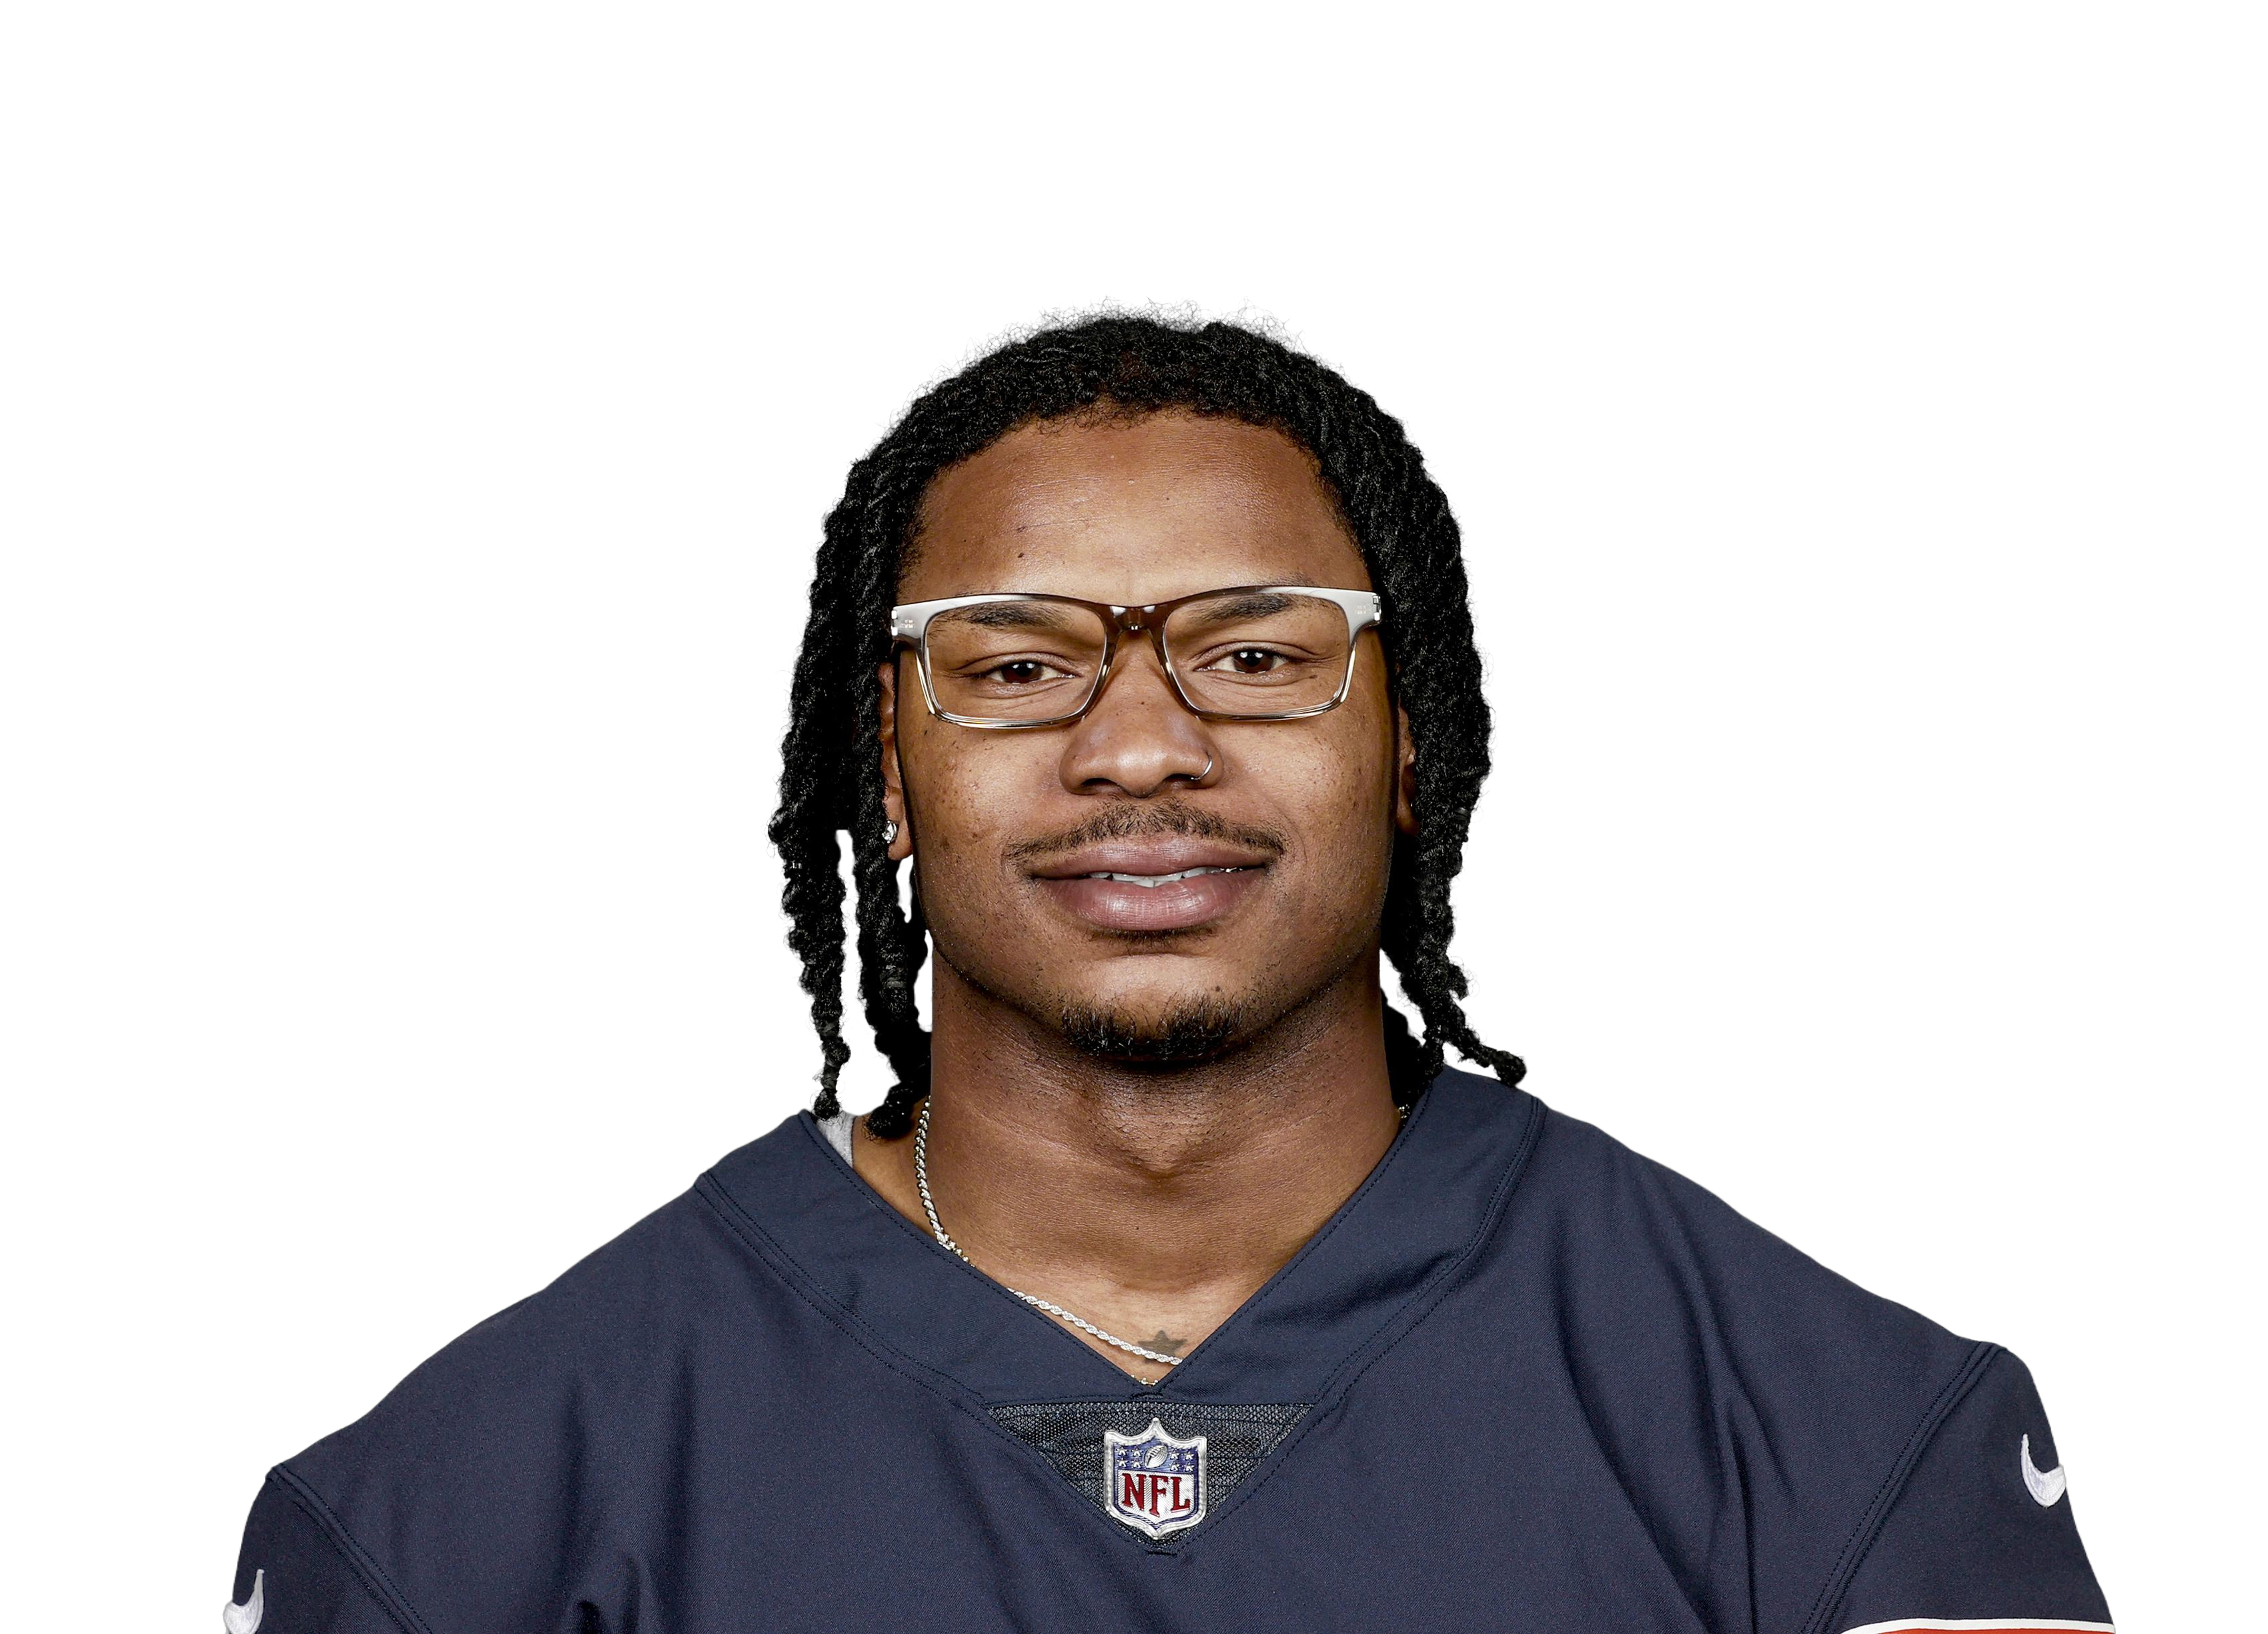 Gerald Everett
|
LAR | 15 | 56 | 27.8 | 2.7 | 4.1 | 41 | 1 | 10.2 | 66.1% | 11.3% | 0.24 | |
| 24 |
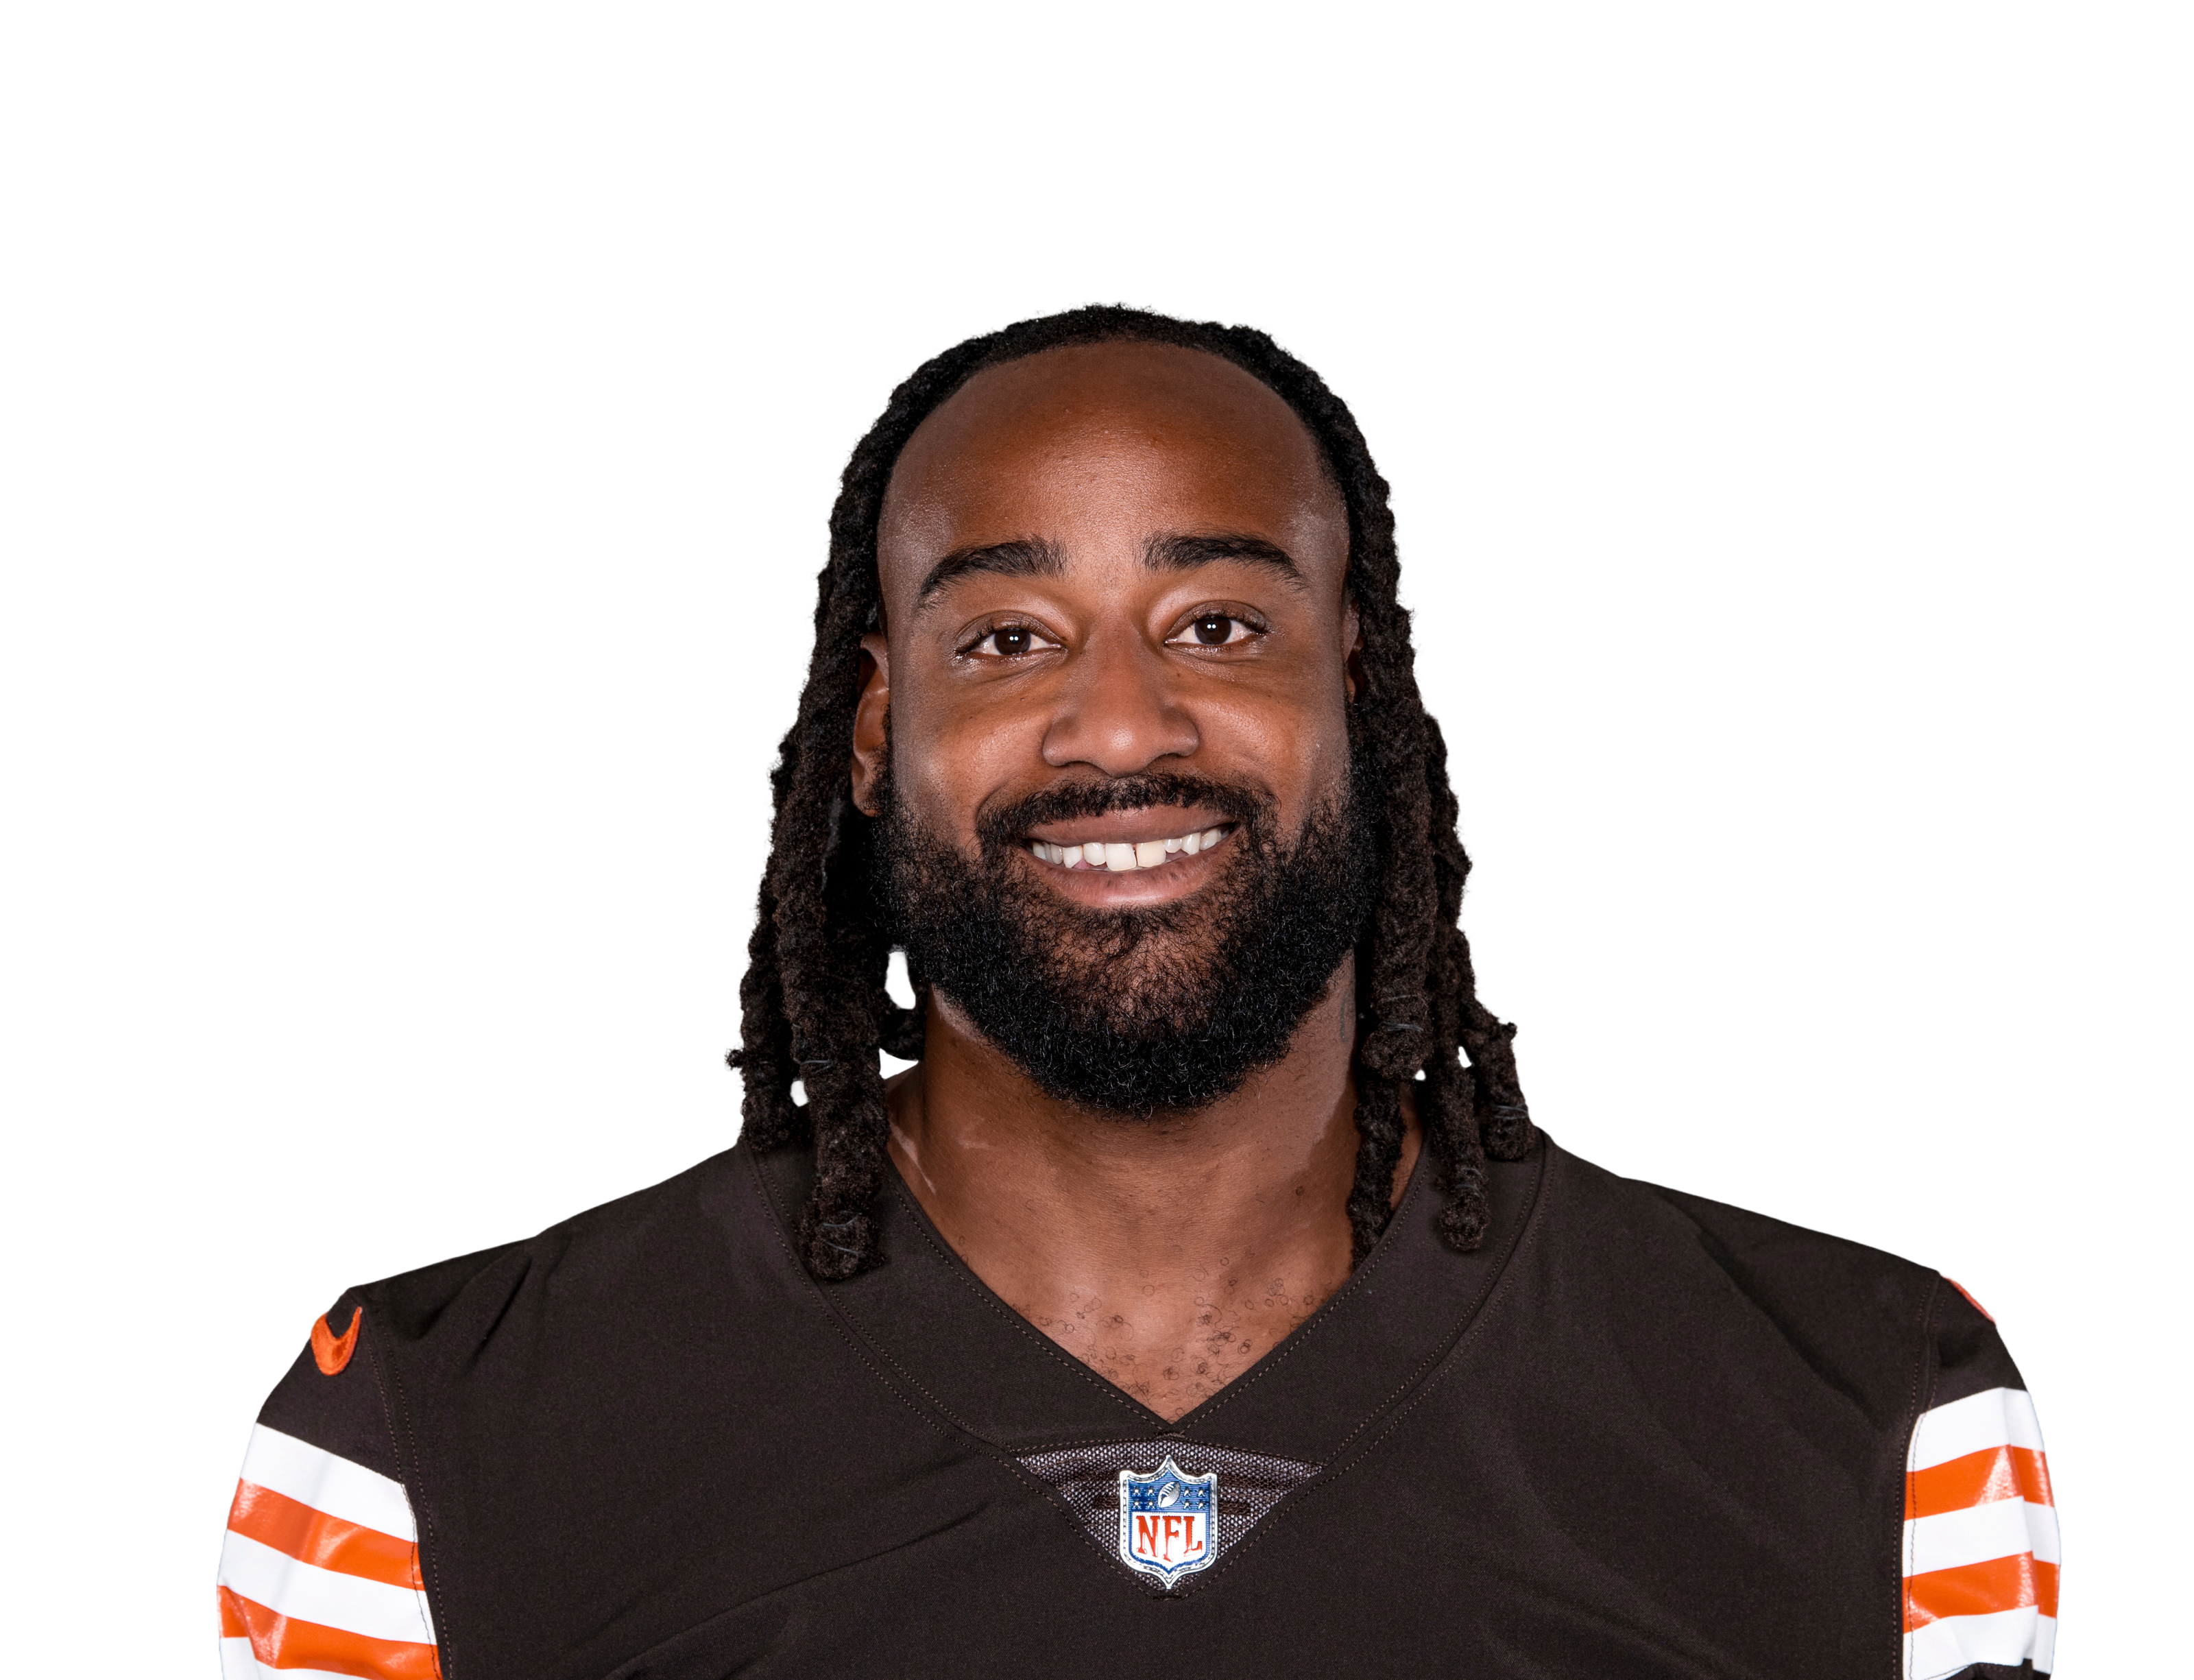 Jordan Akins
|
HOU | 13 | 57 | 31.0 | 2.8 | 3.8 | 37 | 1 | 10.9 | 75.5% | 11.8% | 0.25 | |
| 25 |
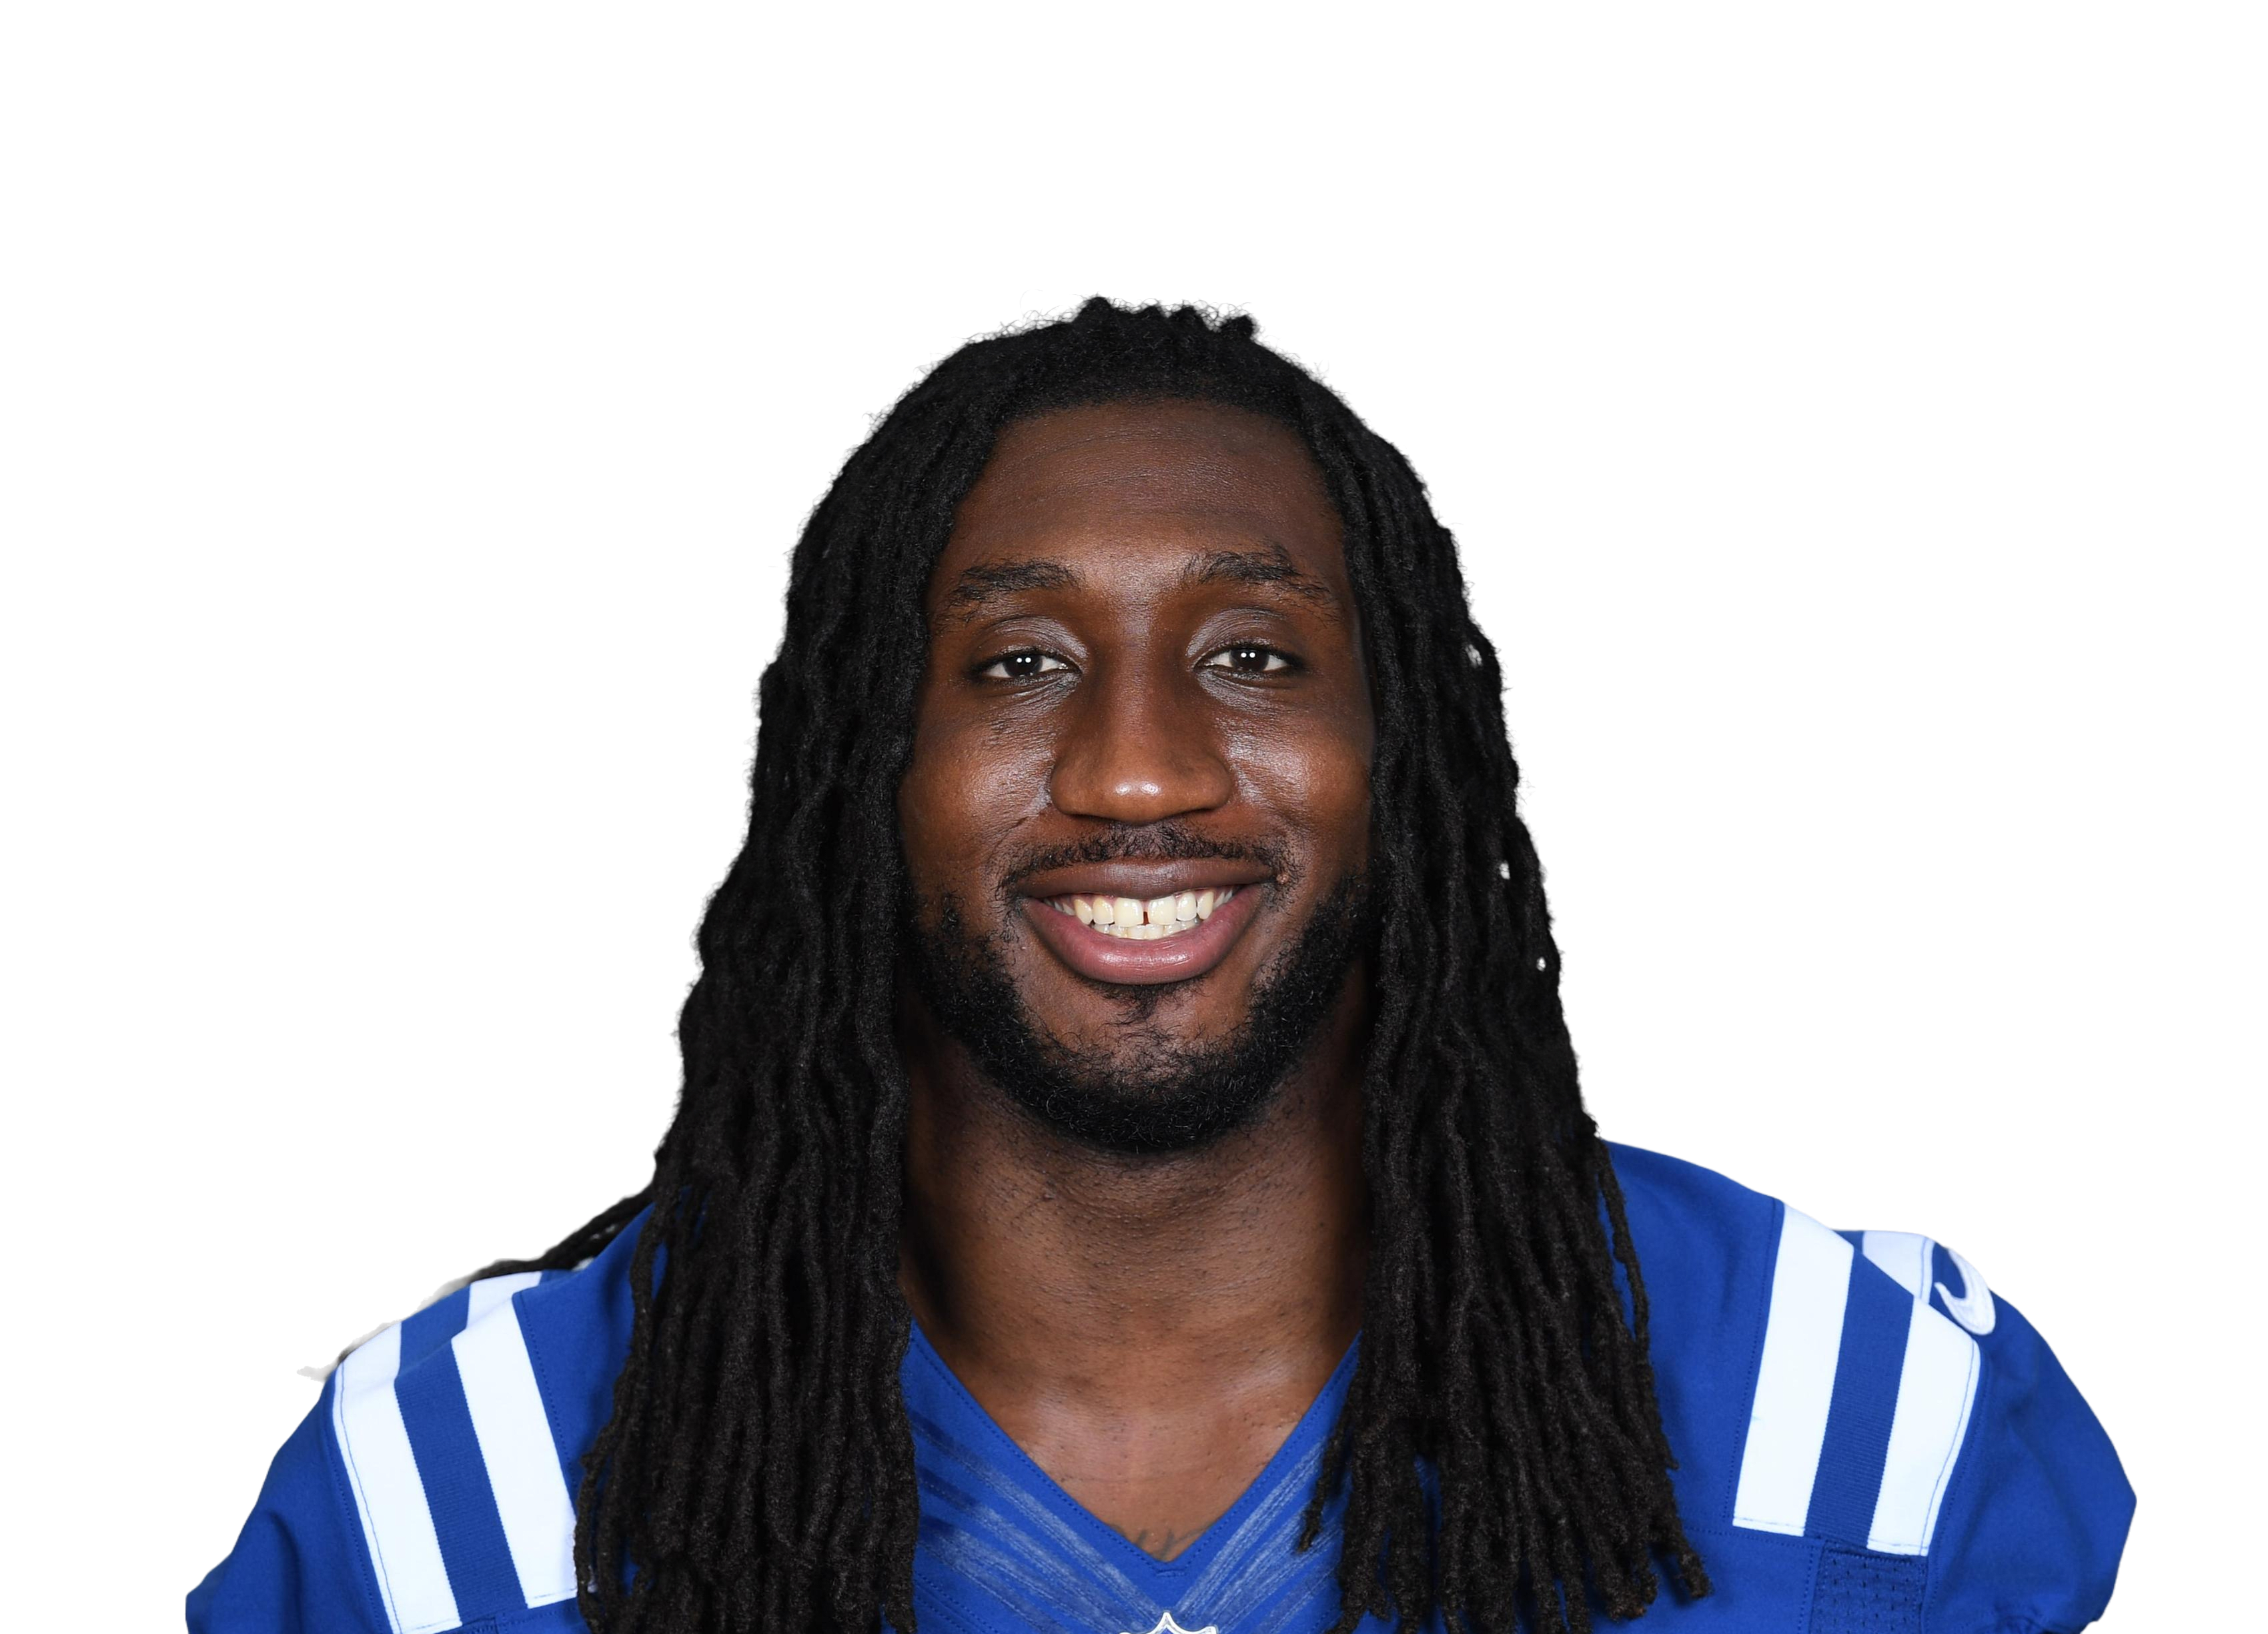 Mo Alie-Cox
|
IND | 14 | 54 | 28.1 | 2.2 | 2.8 | 31 | 2 | 12.7 | 79.5% | 8.8% | 0.19 | |
| 26 |
 Anthony Firkser
|
TEN | 15 | 53 | 25.8 | 2.6 | 3.5 | 39 | 1 | 9.9 | 73.6% | 11.9% | 0.25 | |
| 27 |
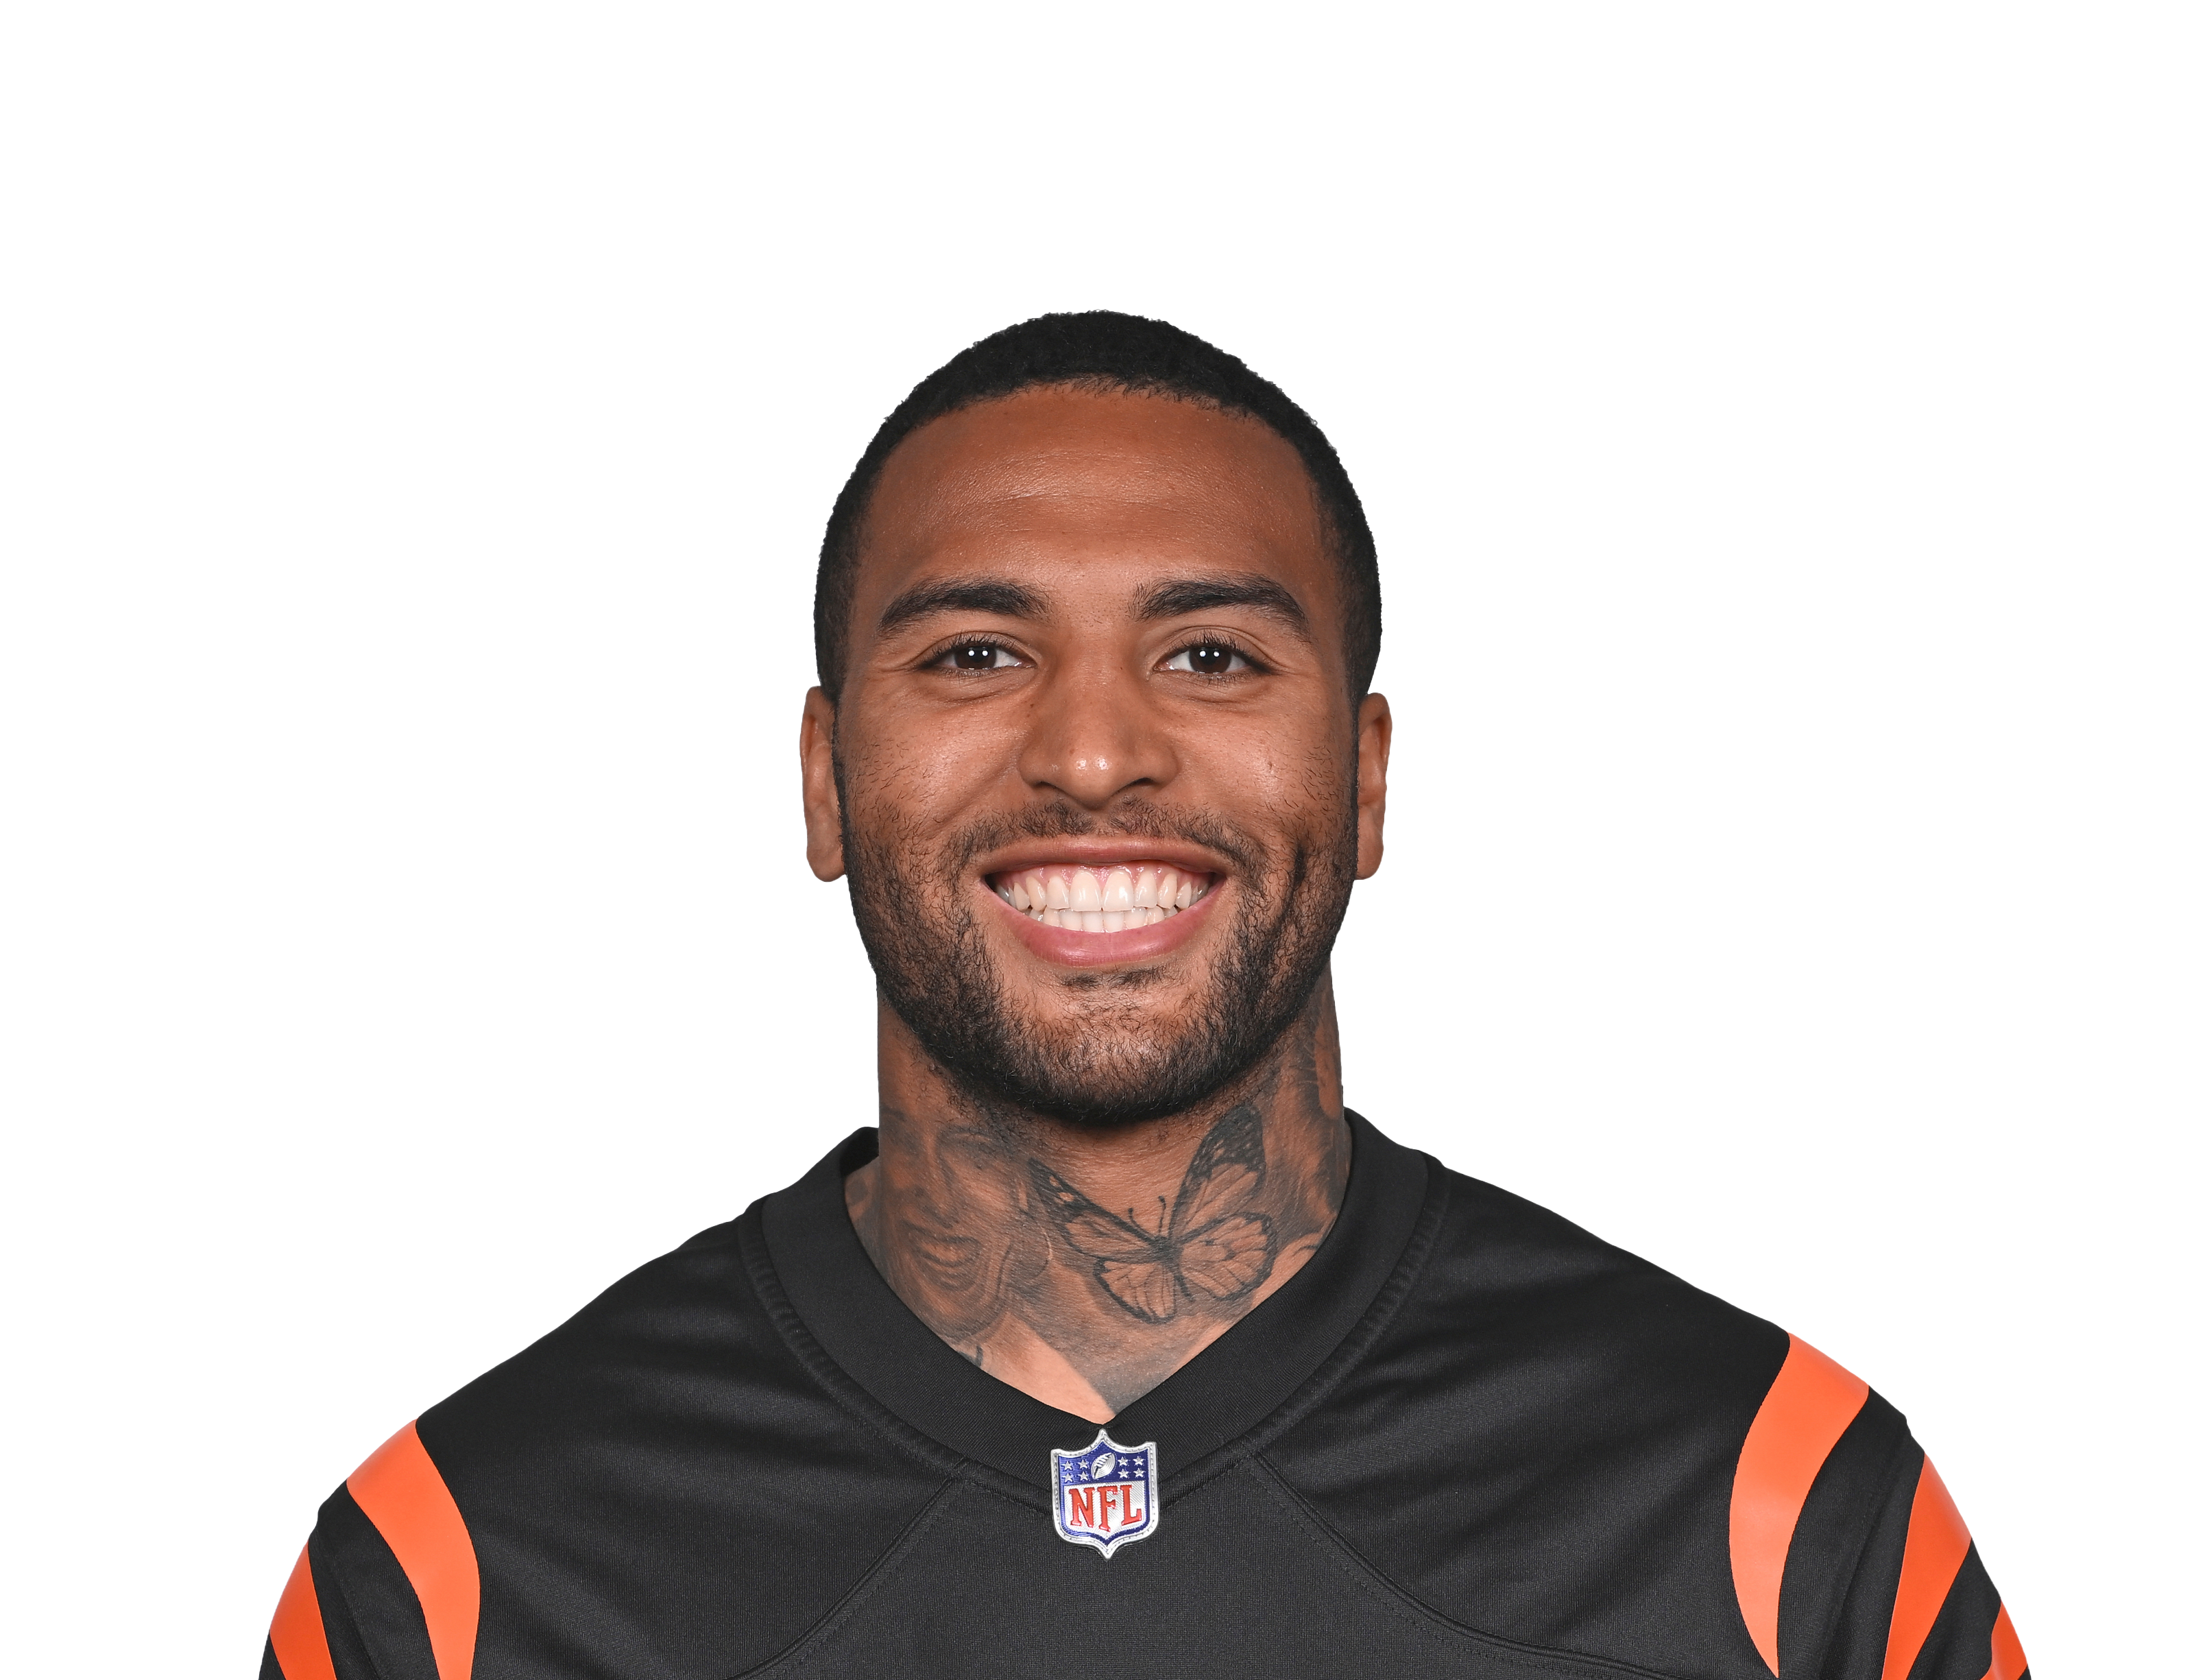 Irv Smith
|
MIN | 13 | 59 | 28.1 | 2.3 | 3.3 | 30 | 5 | 12.2 | 69.8% | 11.1% | 0.26 | |
| 28 |
 Tyler Eifert
|
JAX | 15 | 53 | 23.3 | 2.4 | 4.0 | 36 | 2 | 9.7 | 60.0% | 10.9% | 0.24 | |
| 29 |
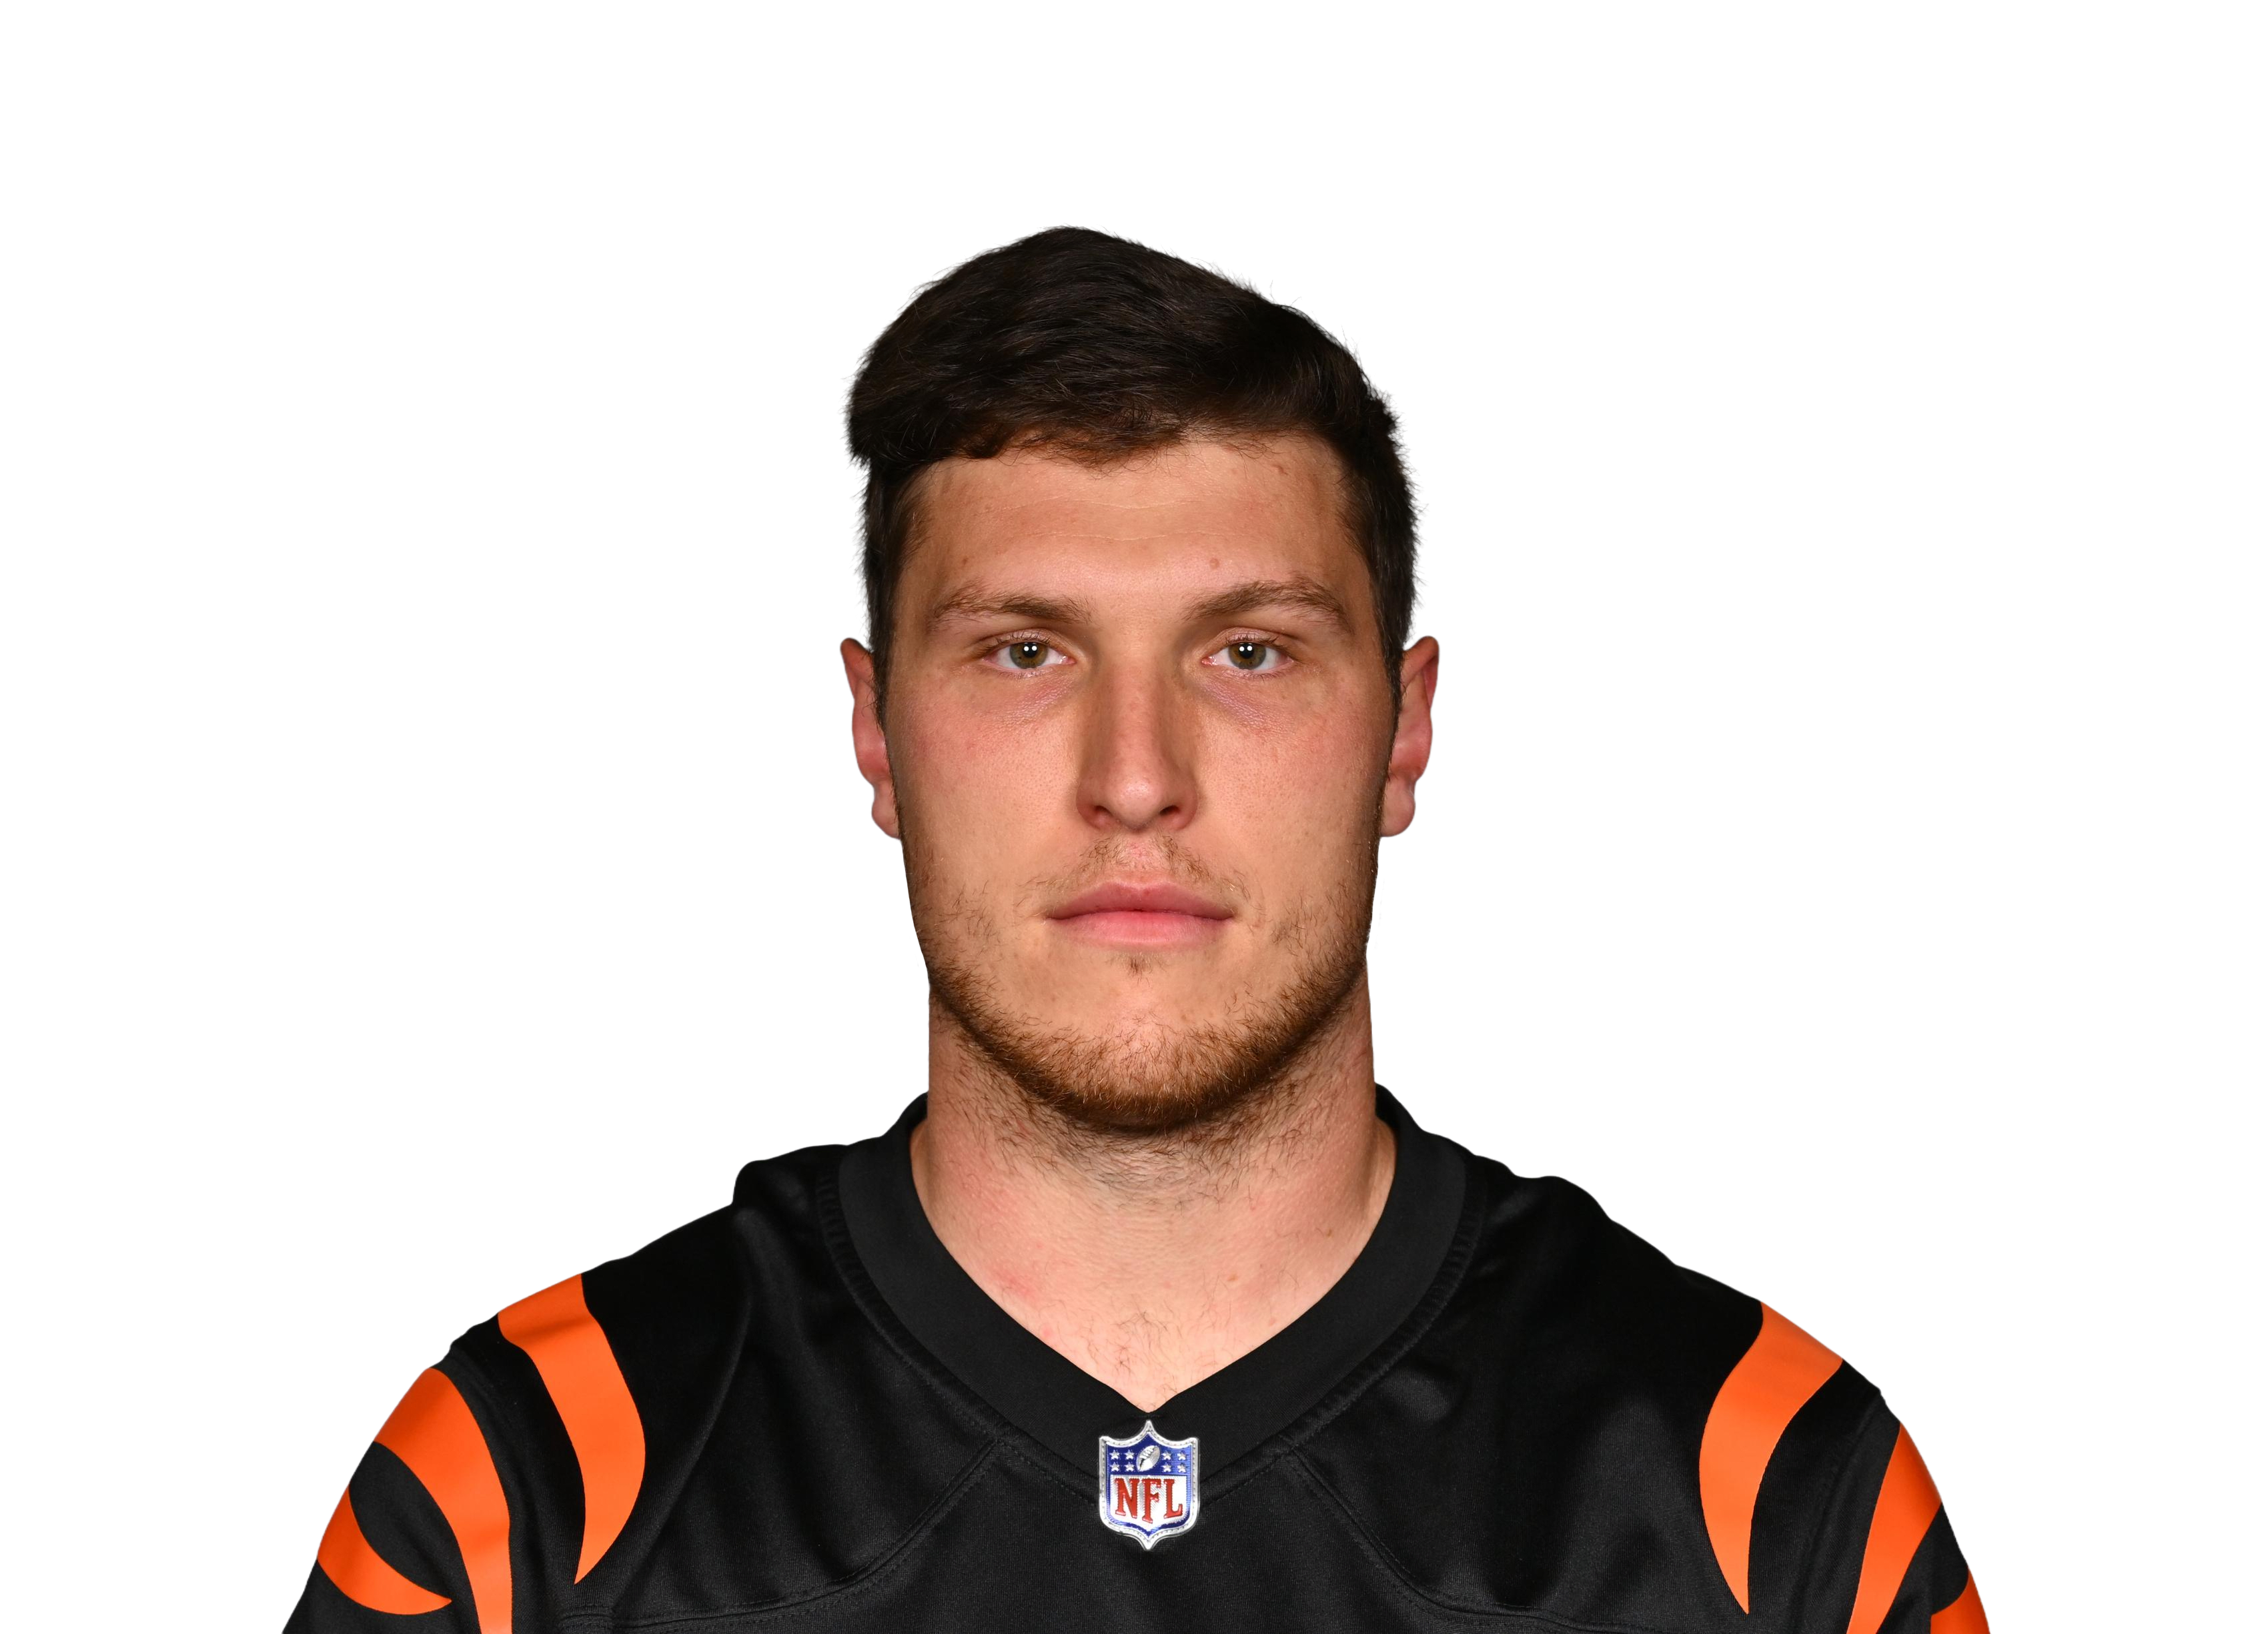 Drew Sample
|
CIN | 16 | 51 | 21.8 | 2.5 | 3.3 | 40 | 1 | 8.7 | 75.5% | 9.7% | 0.18 | |
| 30 |
 Richard Rodgers
|
PHI | 8 | 61 | 43.1 | 3.0 | 3.9 | 24 | 2 | 14.4 | 77.4% | 10.5% | 0.25 | |
| 31 |
 Zach Ertz
|
PHI | 11 | 60 | 30.5 | 3.3 | 6.5 | 36 | 1 | 9.3 | 50.0% | 18.6% | 0.38 | |
| 32 |
 Kyle Rudolph
|
MIN | 12 | 53 | 27.8 | 2.3 | 3.1 | 28 | 1 | 11.9 | 75.7% | 10.6% | 0.21 | |
| 33 |
 Darren Fells
|
HOU | 12 | 57 | 26.0 | 1.8 | 2.3 | 21 | 4 | 14.9 | 75.0% | 7.1% | 0.14 | |
| 34 |
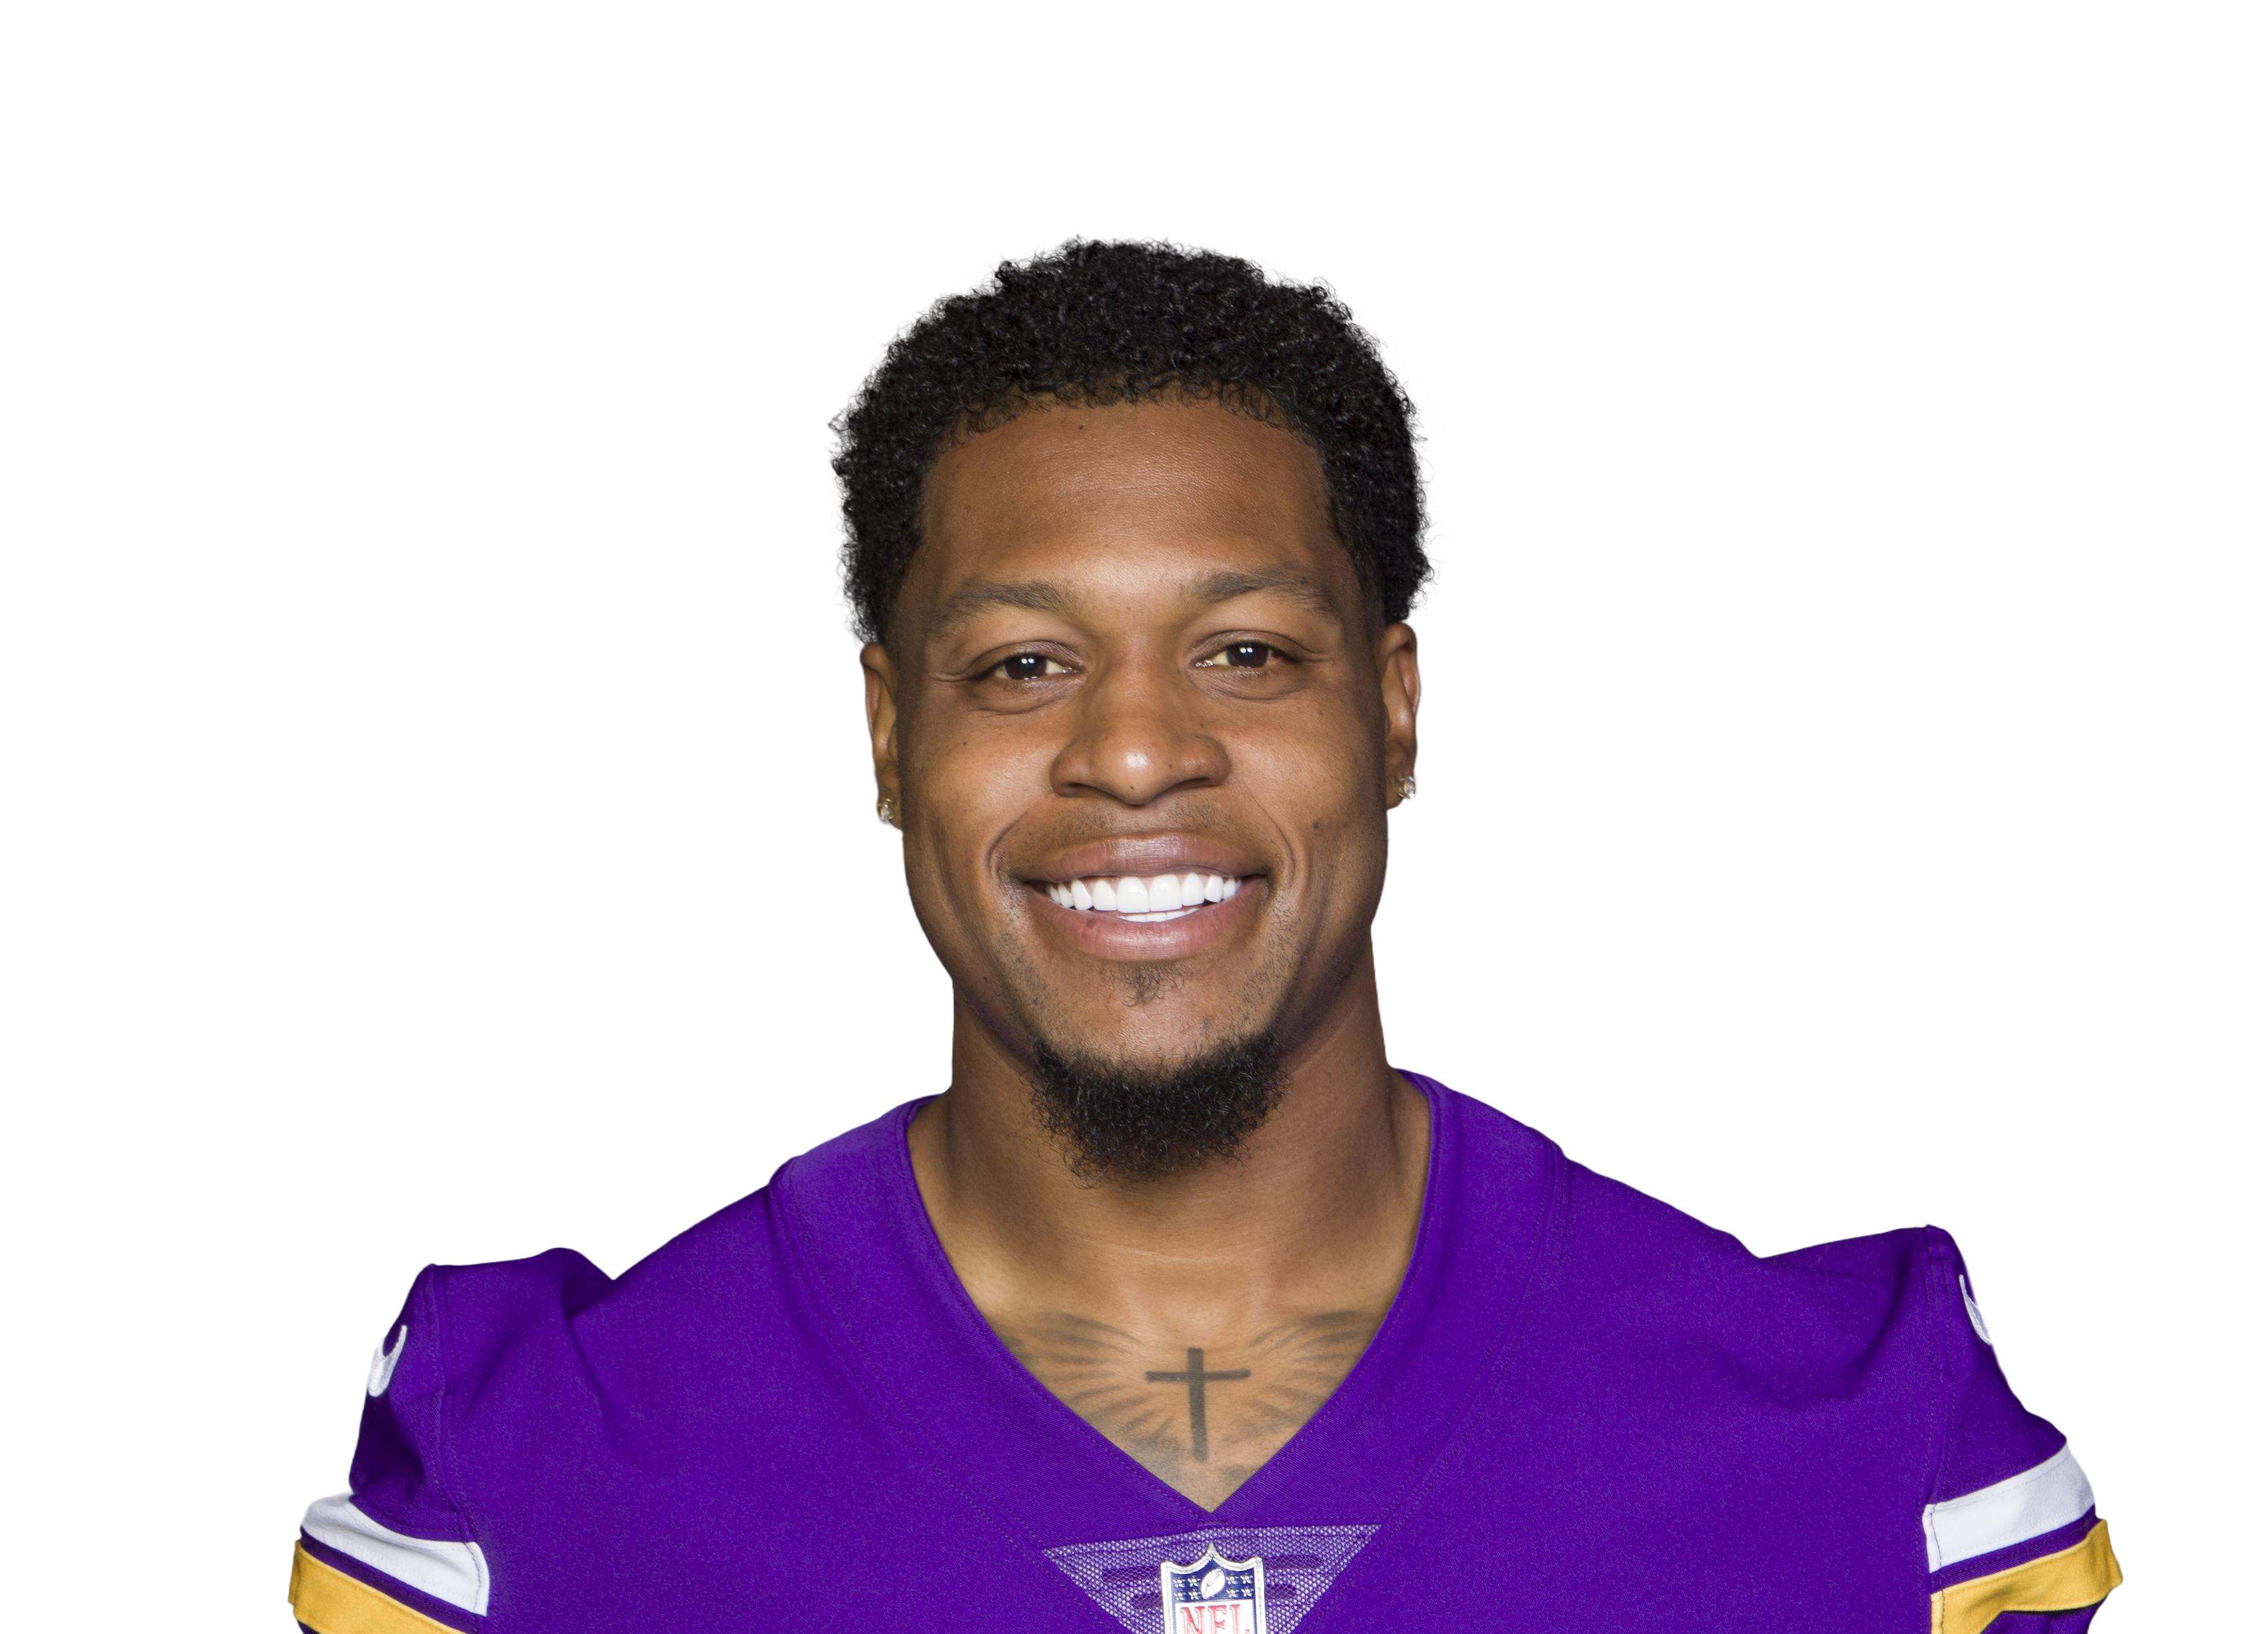 N'Keal Harry
|
NE | 13 | 55 | 23.8 | 2.5 | 4.4 | 33 | 2 | 9.4 | 57.9% | 16.1% | 0.38 | |
| 35 |
 Dawson Knox
|
BUF | 11 | 57 | 26.2 | 2.2 | 4.0 | 24 | 3 | 12.0 | 54.5% | 10.4% | 0.21 | |
| 36 |
 Chris Herndon
|
NYJ | 12 | 58 | 23.9 | 2.6 | 3.8 | 31 | 3 | 9.3 | 68.9% | 12.3% | 0.26 | |
| 37 |
 Cameron Brate
|
TB | 13 | 52 | 21.7 | 2.2 | 2.6 | 28 | 2 | 10.1 | 82.4% | 6.6% | 0.14 | |
| 38 |
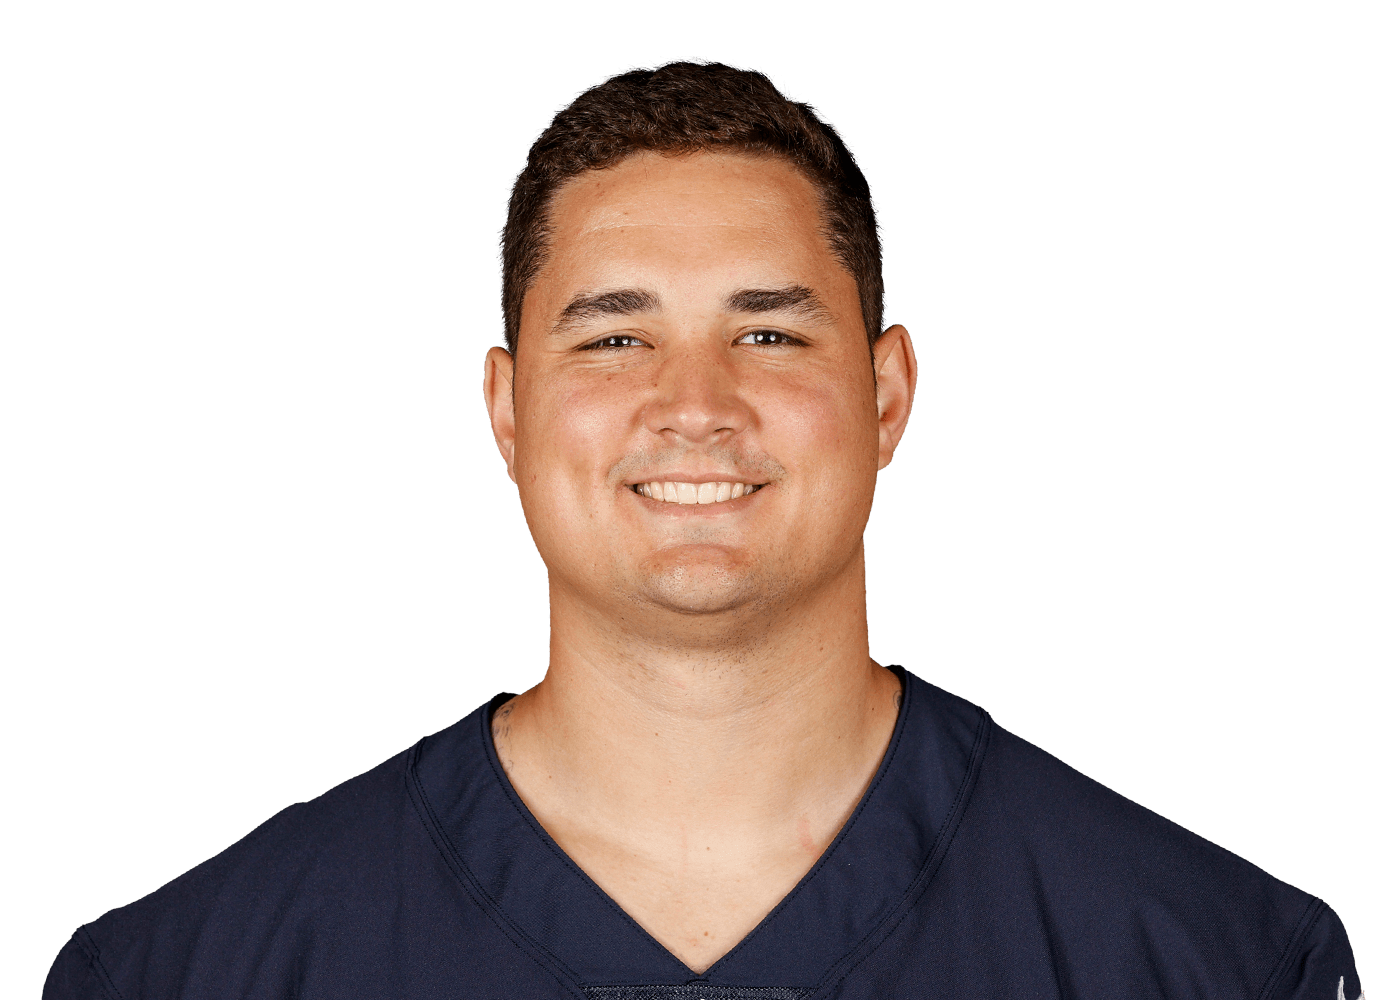 James O'Shaughnessy
|
JAX | 15 | 42 | 17.5 | 1.9 | 2.5 | 28 | 0 | 9.4 | 73.7% | 7.0% | 0.14 | |
| 39 |
 Will Dissly
|
SEA | 15 | 46 | 16.7 | 1.6 | 1.9 | 24 | 2 | 10.5 | 82.8% | 5.5% | 0.10 | |
| 40 |
 Jack Doyle
|
IND | 13 | 51 | 19.3 | 1.8 | 2.5 | 23 | 3 | 10.9 | 69.7% | 7.5% | 0.16 | |
| 41 |
 Trey Burton
|
IND | 12 | 55 | 20.8 | 2.3 | 3.9 | 28 | 3 | 8.9 | 59.6% | 11.2% | 0.24 | |
| 42 |
 Ross Dwelley
|
SF | 12 | 47 | 20.4 | 1.6 | 2.0 | 19 | 1 | 12.9 | 79.2% | 5.4% | 0.12 | |
| 43 |
 Cole Kmet
|
CHI | 15 | 47 | 16.2 | 1.9 | 2.9 | 28 | 2 | 8.7 | 63.6% | 8.5% | 0.18 | |
| 44 |
 Greg Olsen
|
SEA | 11 | 50 | 21.7 | 2.2 | 3.4 | 24 | 1 | 10.0 | 64.9% | 9.7% | 0.20 | |
| 45 |
 Harrison Bryant
|
CLE | 12 | 54 | 19.8 | 2.0 | 3.2 | 24 | 3 | 9.9 | 63.2% | 10.1% | 0.21 | |
| 46 |
 Jordan Reed
|
SF | 10 | 59 | 23.1 | 2.6 | 4.6 | 26 | 4 | 8.9 | 56.5% | 13.5% | 0.32 | |
| 47 |
 David Njoku
|
CLE | 11 | 50 | 19.4 | 1.7 | 2.6 | 19 | 2 | 11.2 | 65.5% | 8.5% | 0.18 | |
| 48 |
 Jacob Hollister
|
SEA | 13 | 52 | 16.1 | 1.9 | 3.1 | 25 | 3 | 8.4 | 62.5% | 9.1% | 0.18 | |
| 49 |
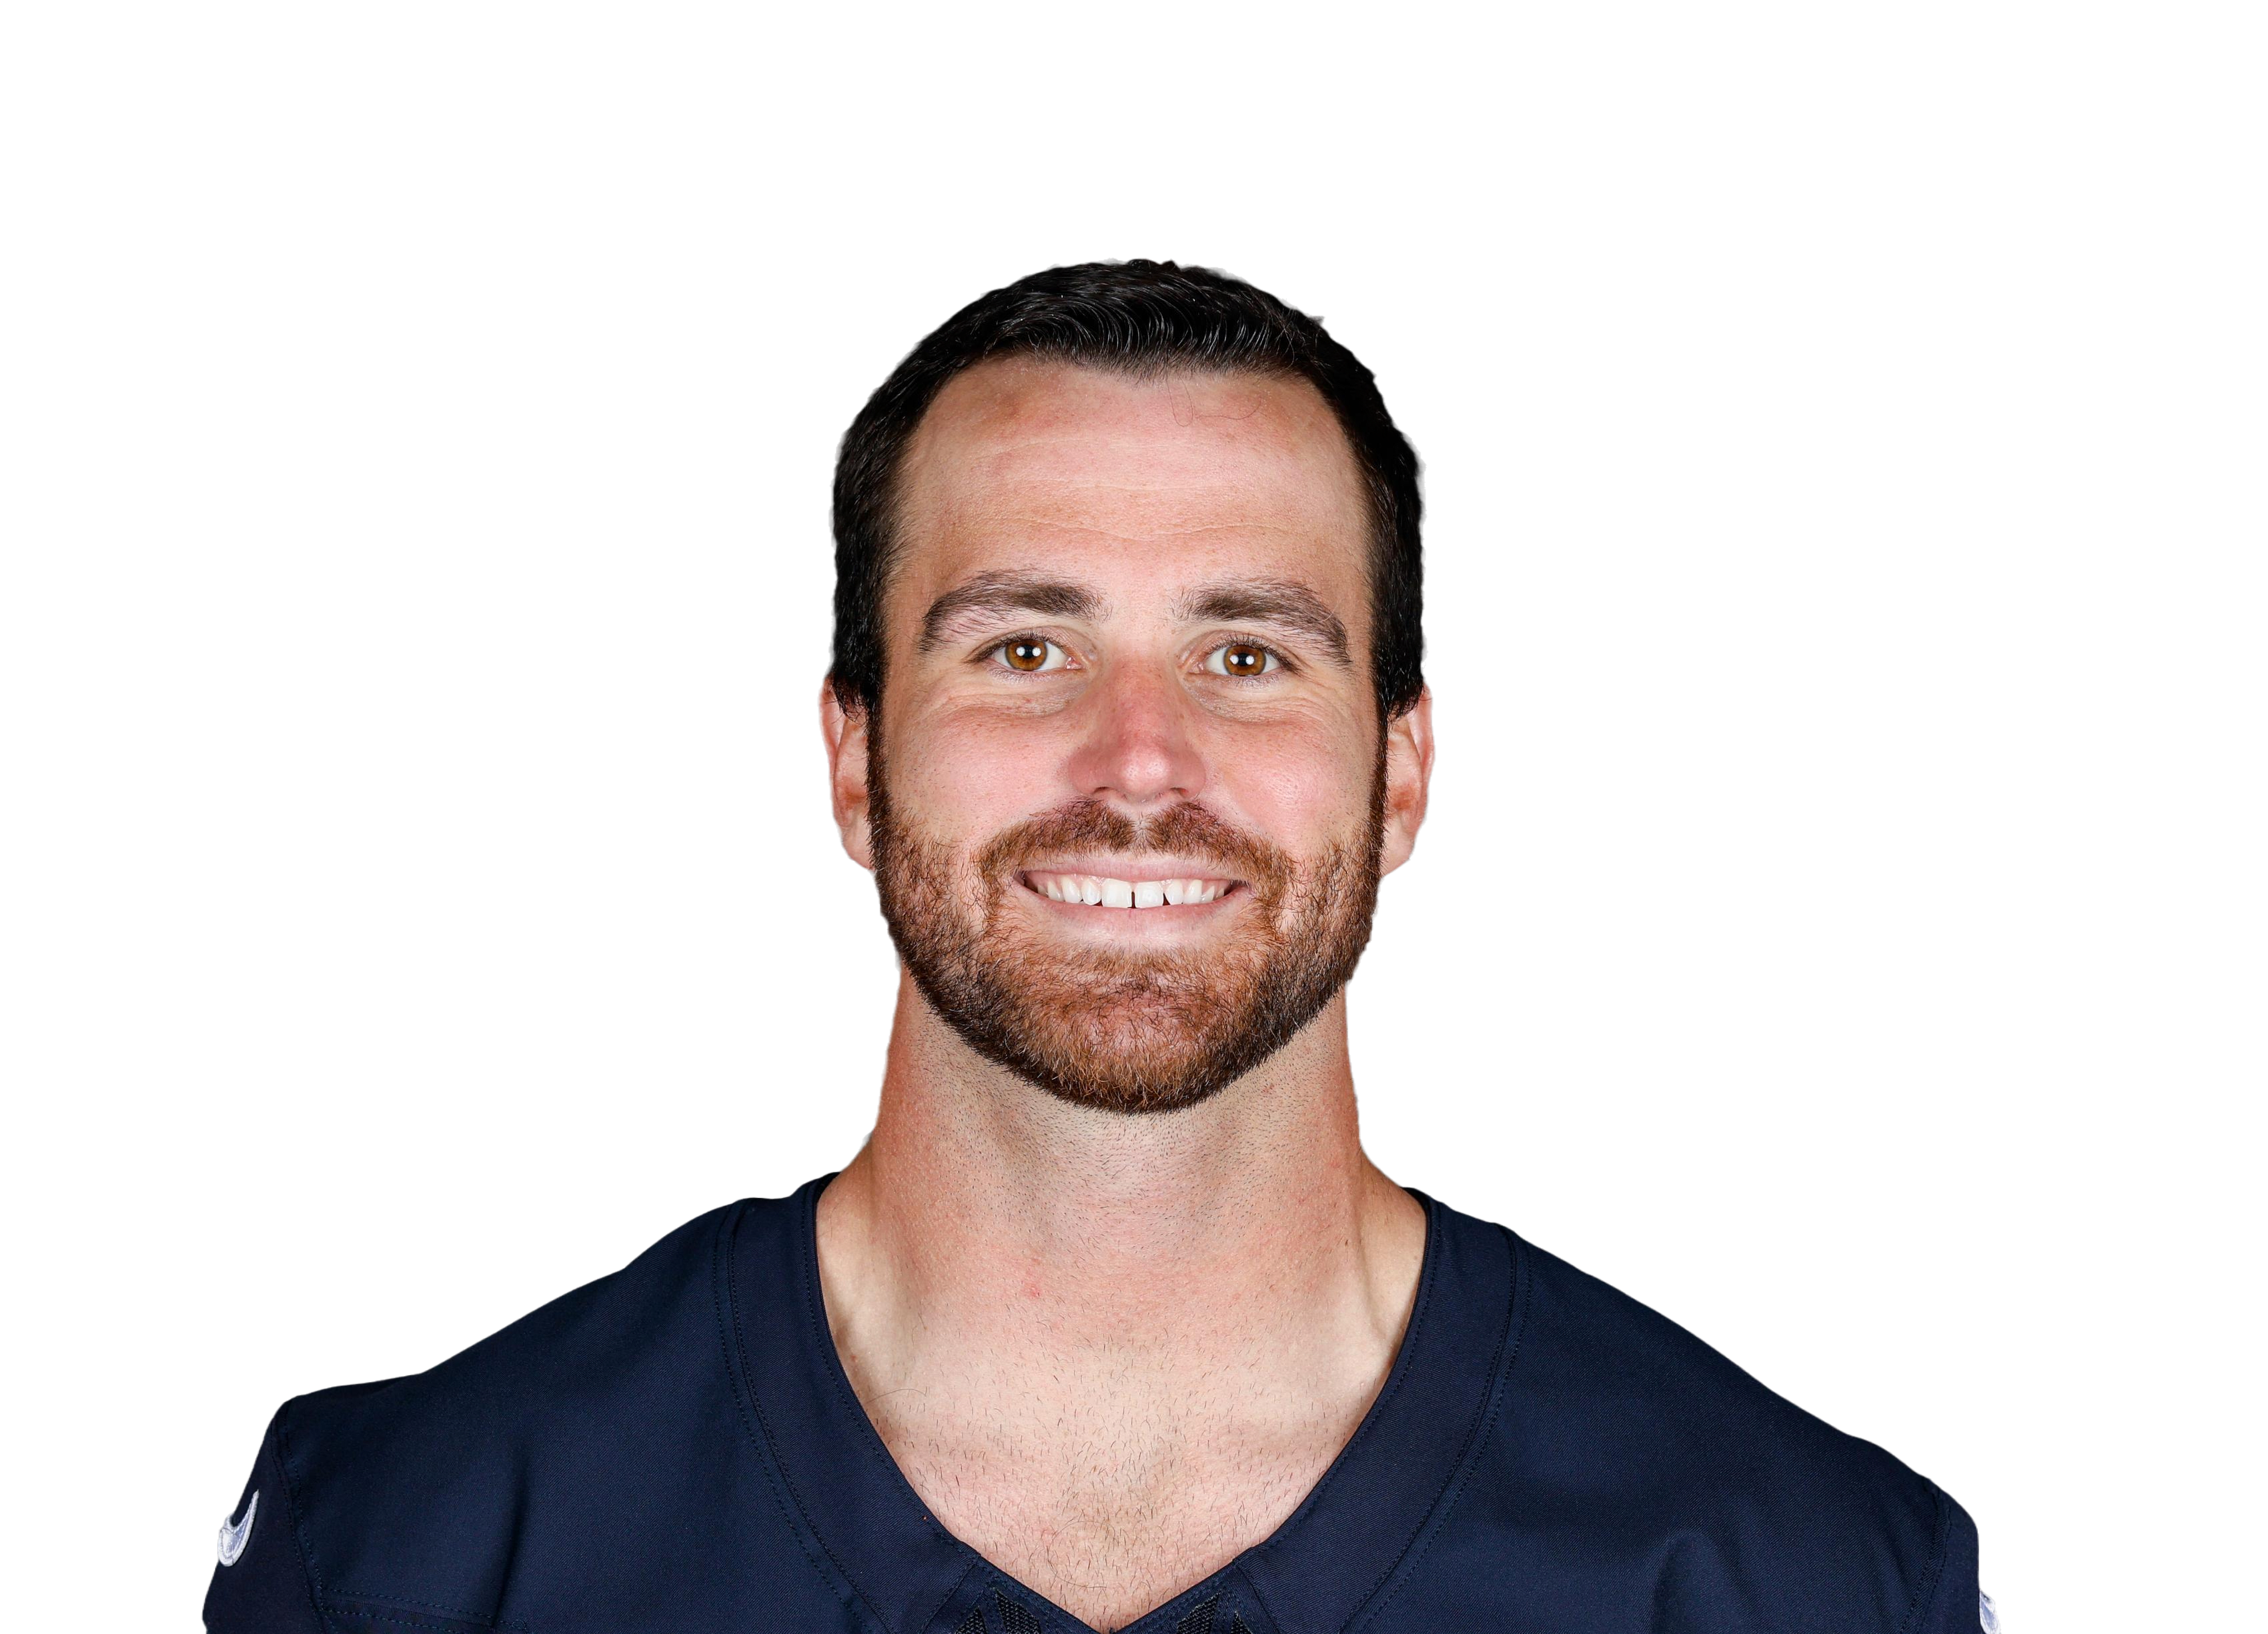 Durham Smythe
|
MIA | 13 | 49 | 16.0 | 2.0 | 2.2 | 26 | 2 | 8.0 | 89.7% | 7.0% | 0.13 | |
| 50 |
 Ryan Izzo
|
NE | 10 | 43 | 19.9 | 1.3 | 2.0 | 13 | 0 | 15.3 | 65.0% | 7.5% | 0.19 | |
| 51 |
 Tyler Conklin
|
MIN | 9 | 50 | 21.6 | 2.1 | 2.9 | 19 | 1 | 10.2 | 73.1% | 8.1% | 0.15 | |
| 52 |
 Adam Trautman
|
NO | 10 | 45 | 17.1 | 1.5 | 1.6 | 15 | 1 | 11.4 | 93.8% | 5.3% | 0.10 | |
| 53 |
 Pharaoh Brown
|
HOU | 10 | 47 | 16.3 | 1.4 | 1.6 | 14 | 2 | 11.6 | 87.5% | 4.5% | 0.10 | |
| 54 |
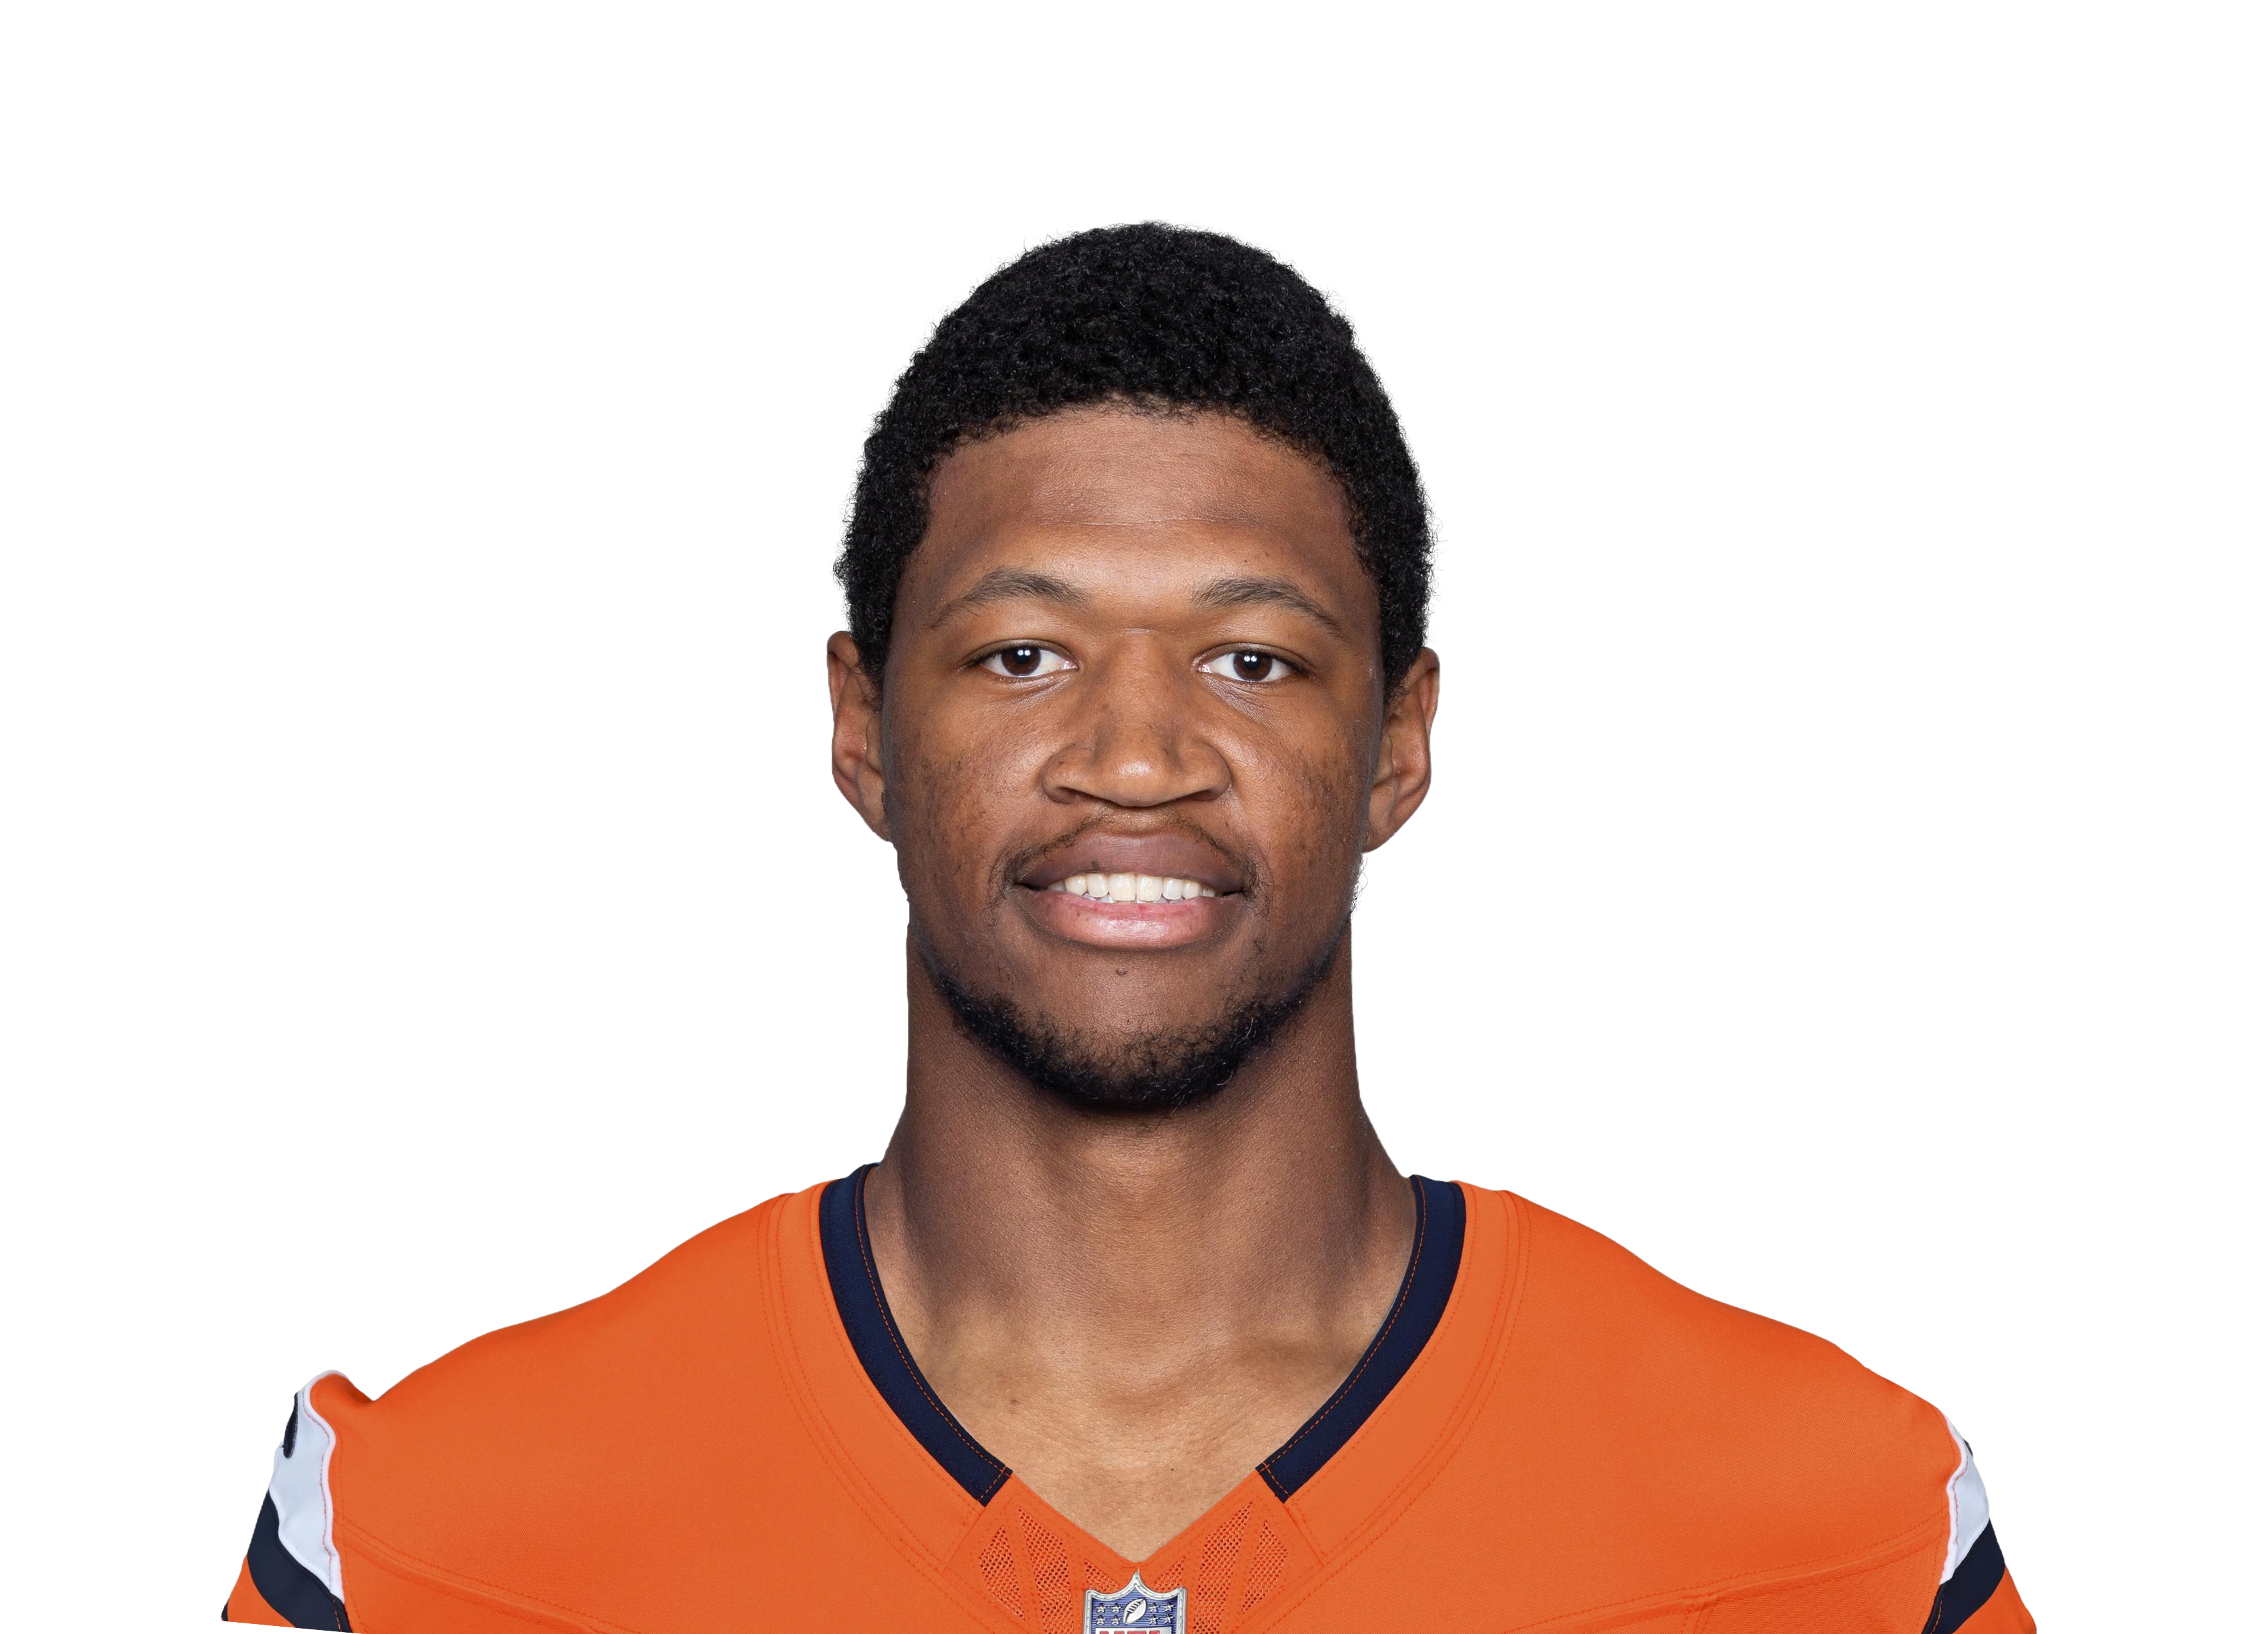 Donald Parham
|
LAC | 11 | 46 | 14.5 | 0.9 | 1.8 | 10 | 3 | 15.9 | 50.0% | 5.0% | 0.12 | |
| 55 |
 Adam Shaheen
|
MIA | 13 | 42 | 11.5 | 0.9 | 1.7 | 12 | 3 | 12.5 | 54.5% | 4.9% | 0.09 | |
| 56 |
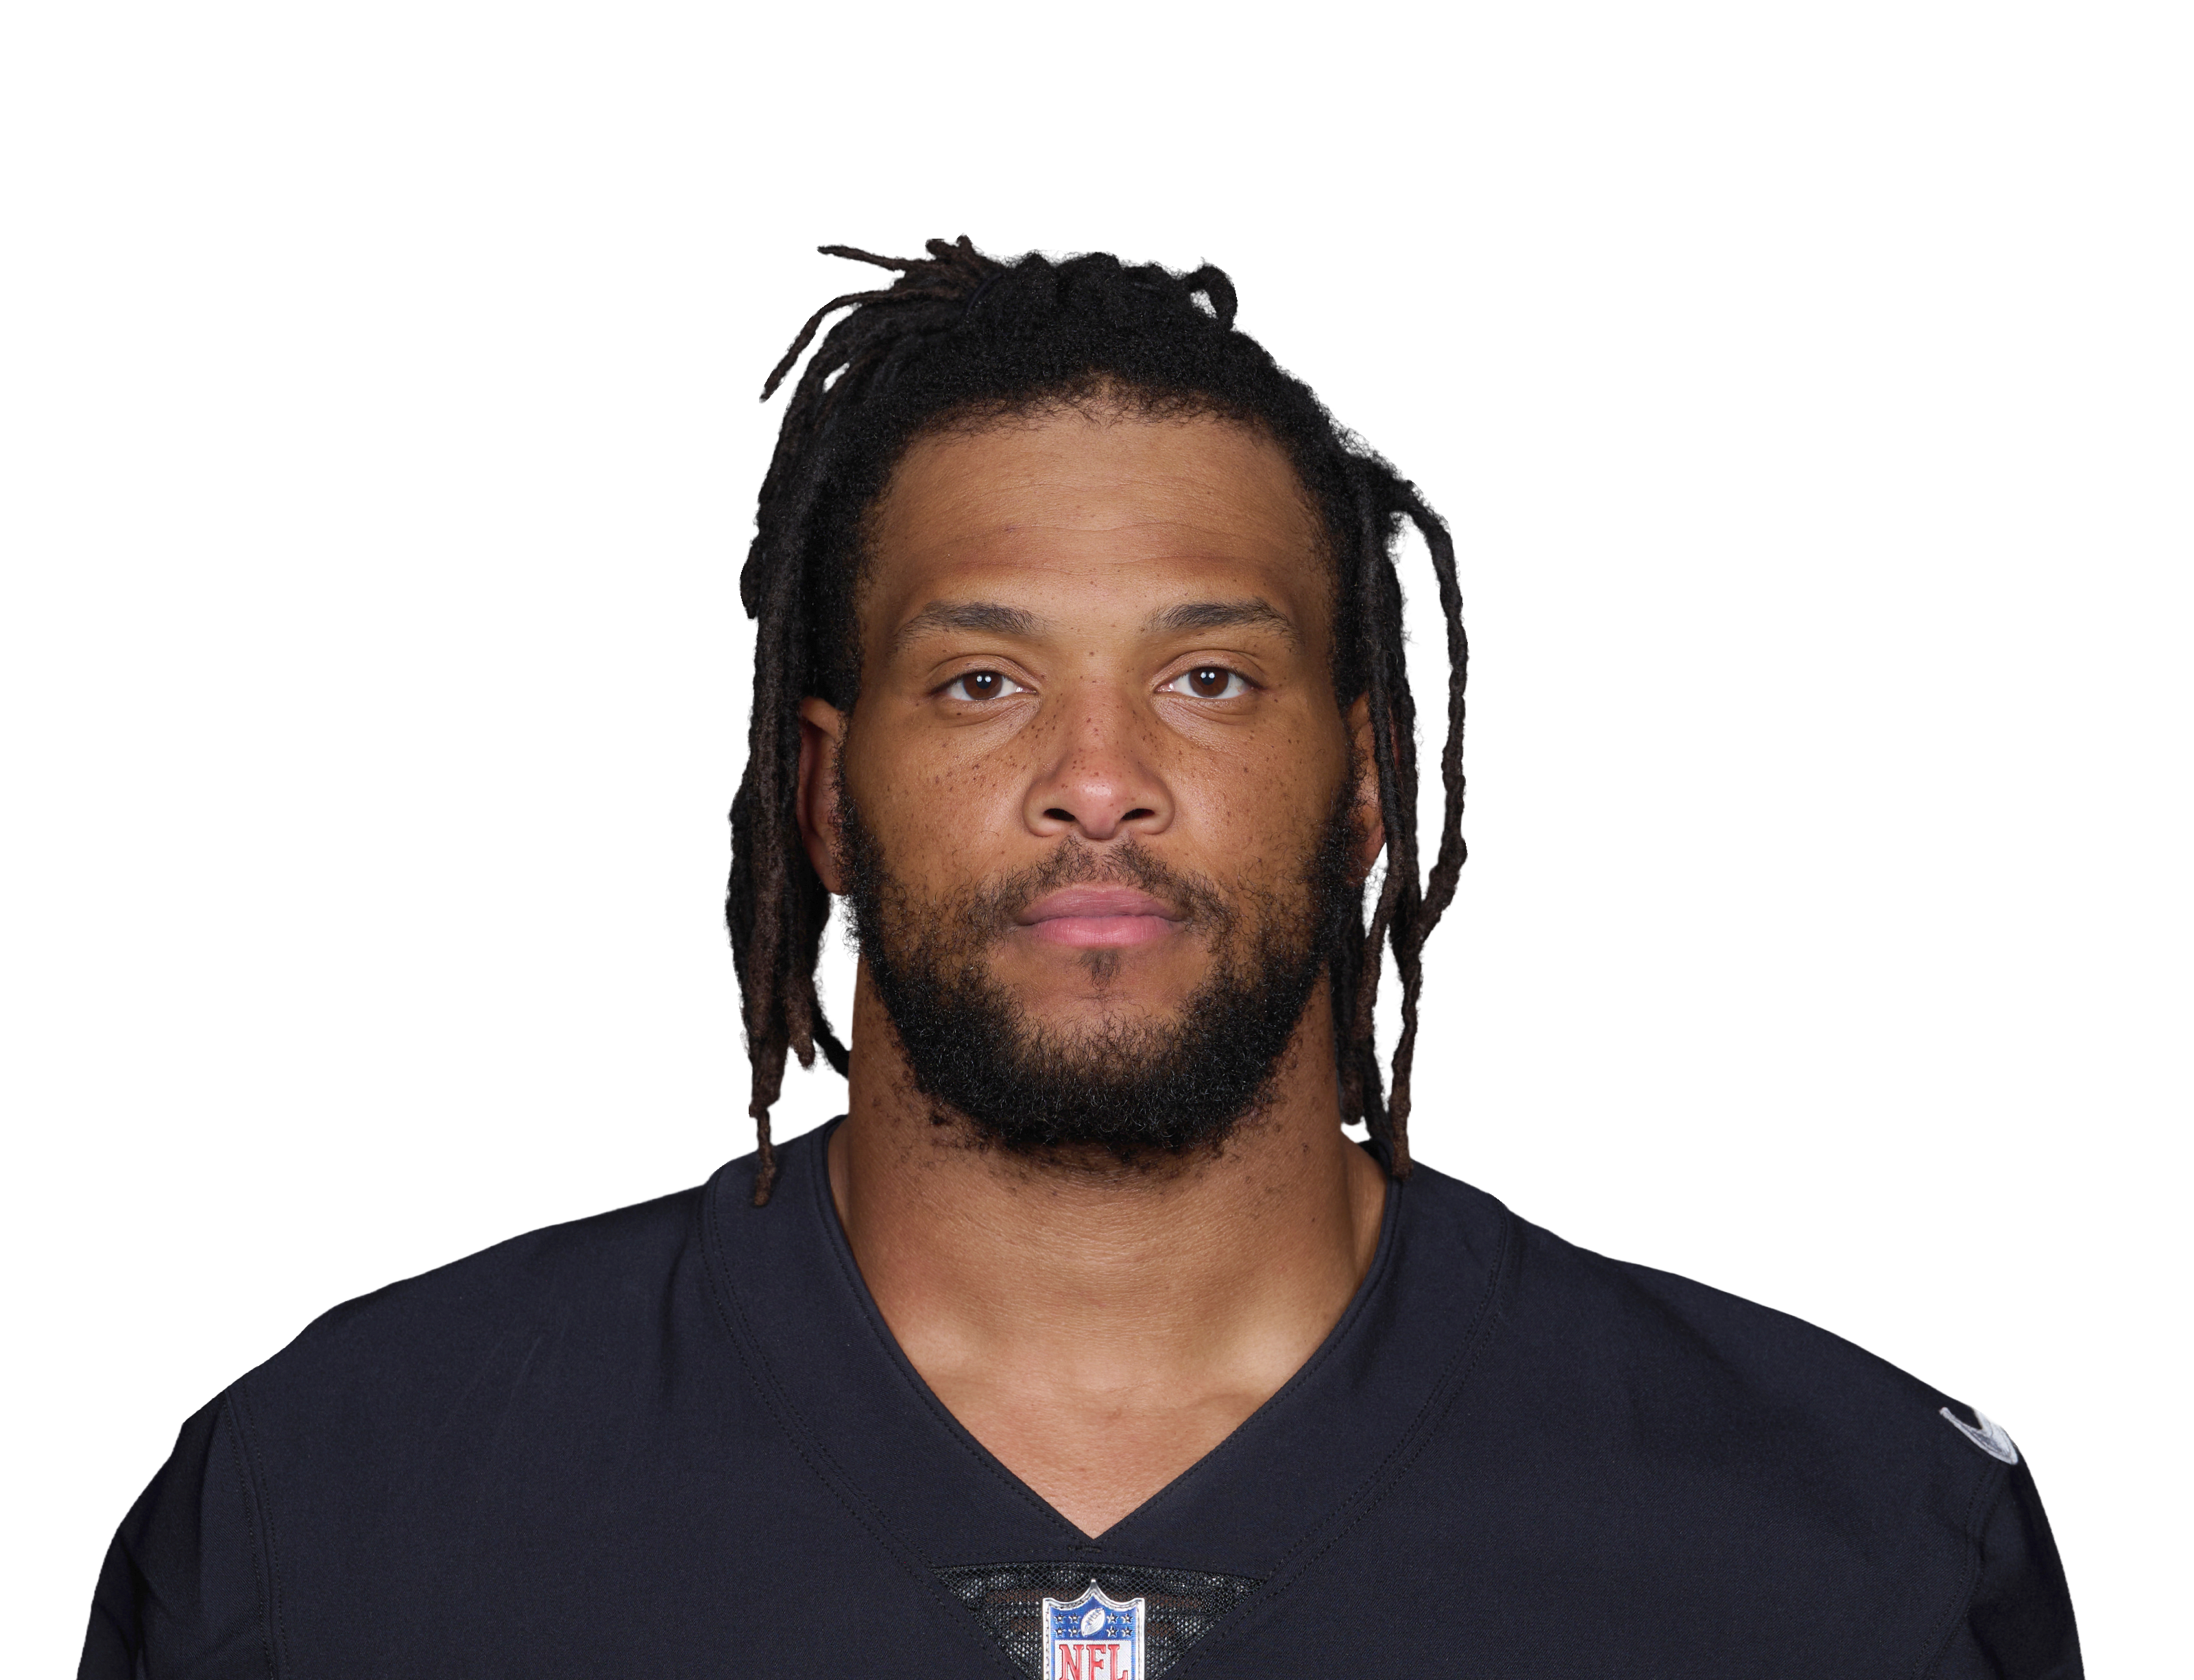 O.J. Howard
|
TB | 4 | — | 36.5 | 2.8 | 4.8 | 11 | 2 | 13.3 | 57.9% | 12.7% | 0.31 | |
| 57 |
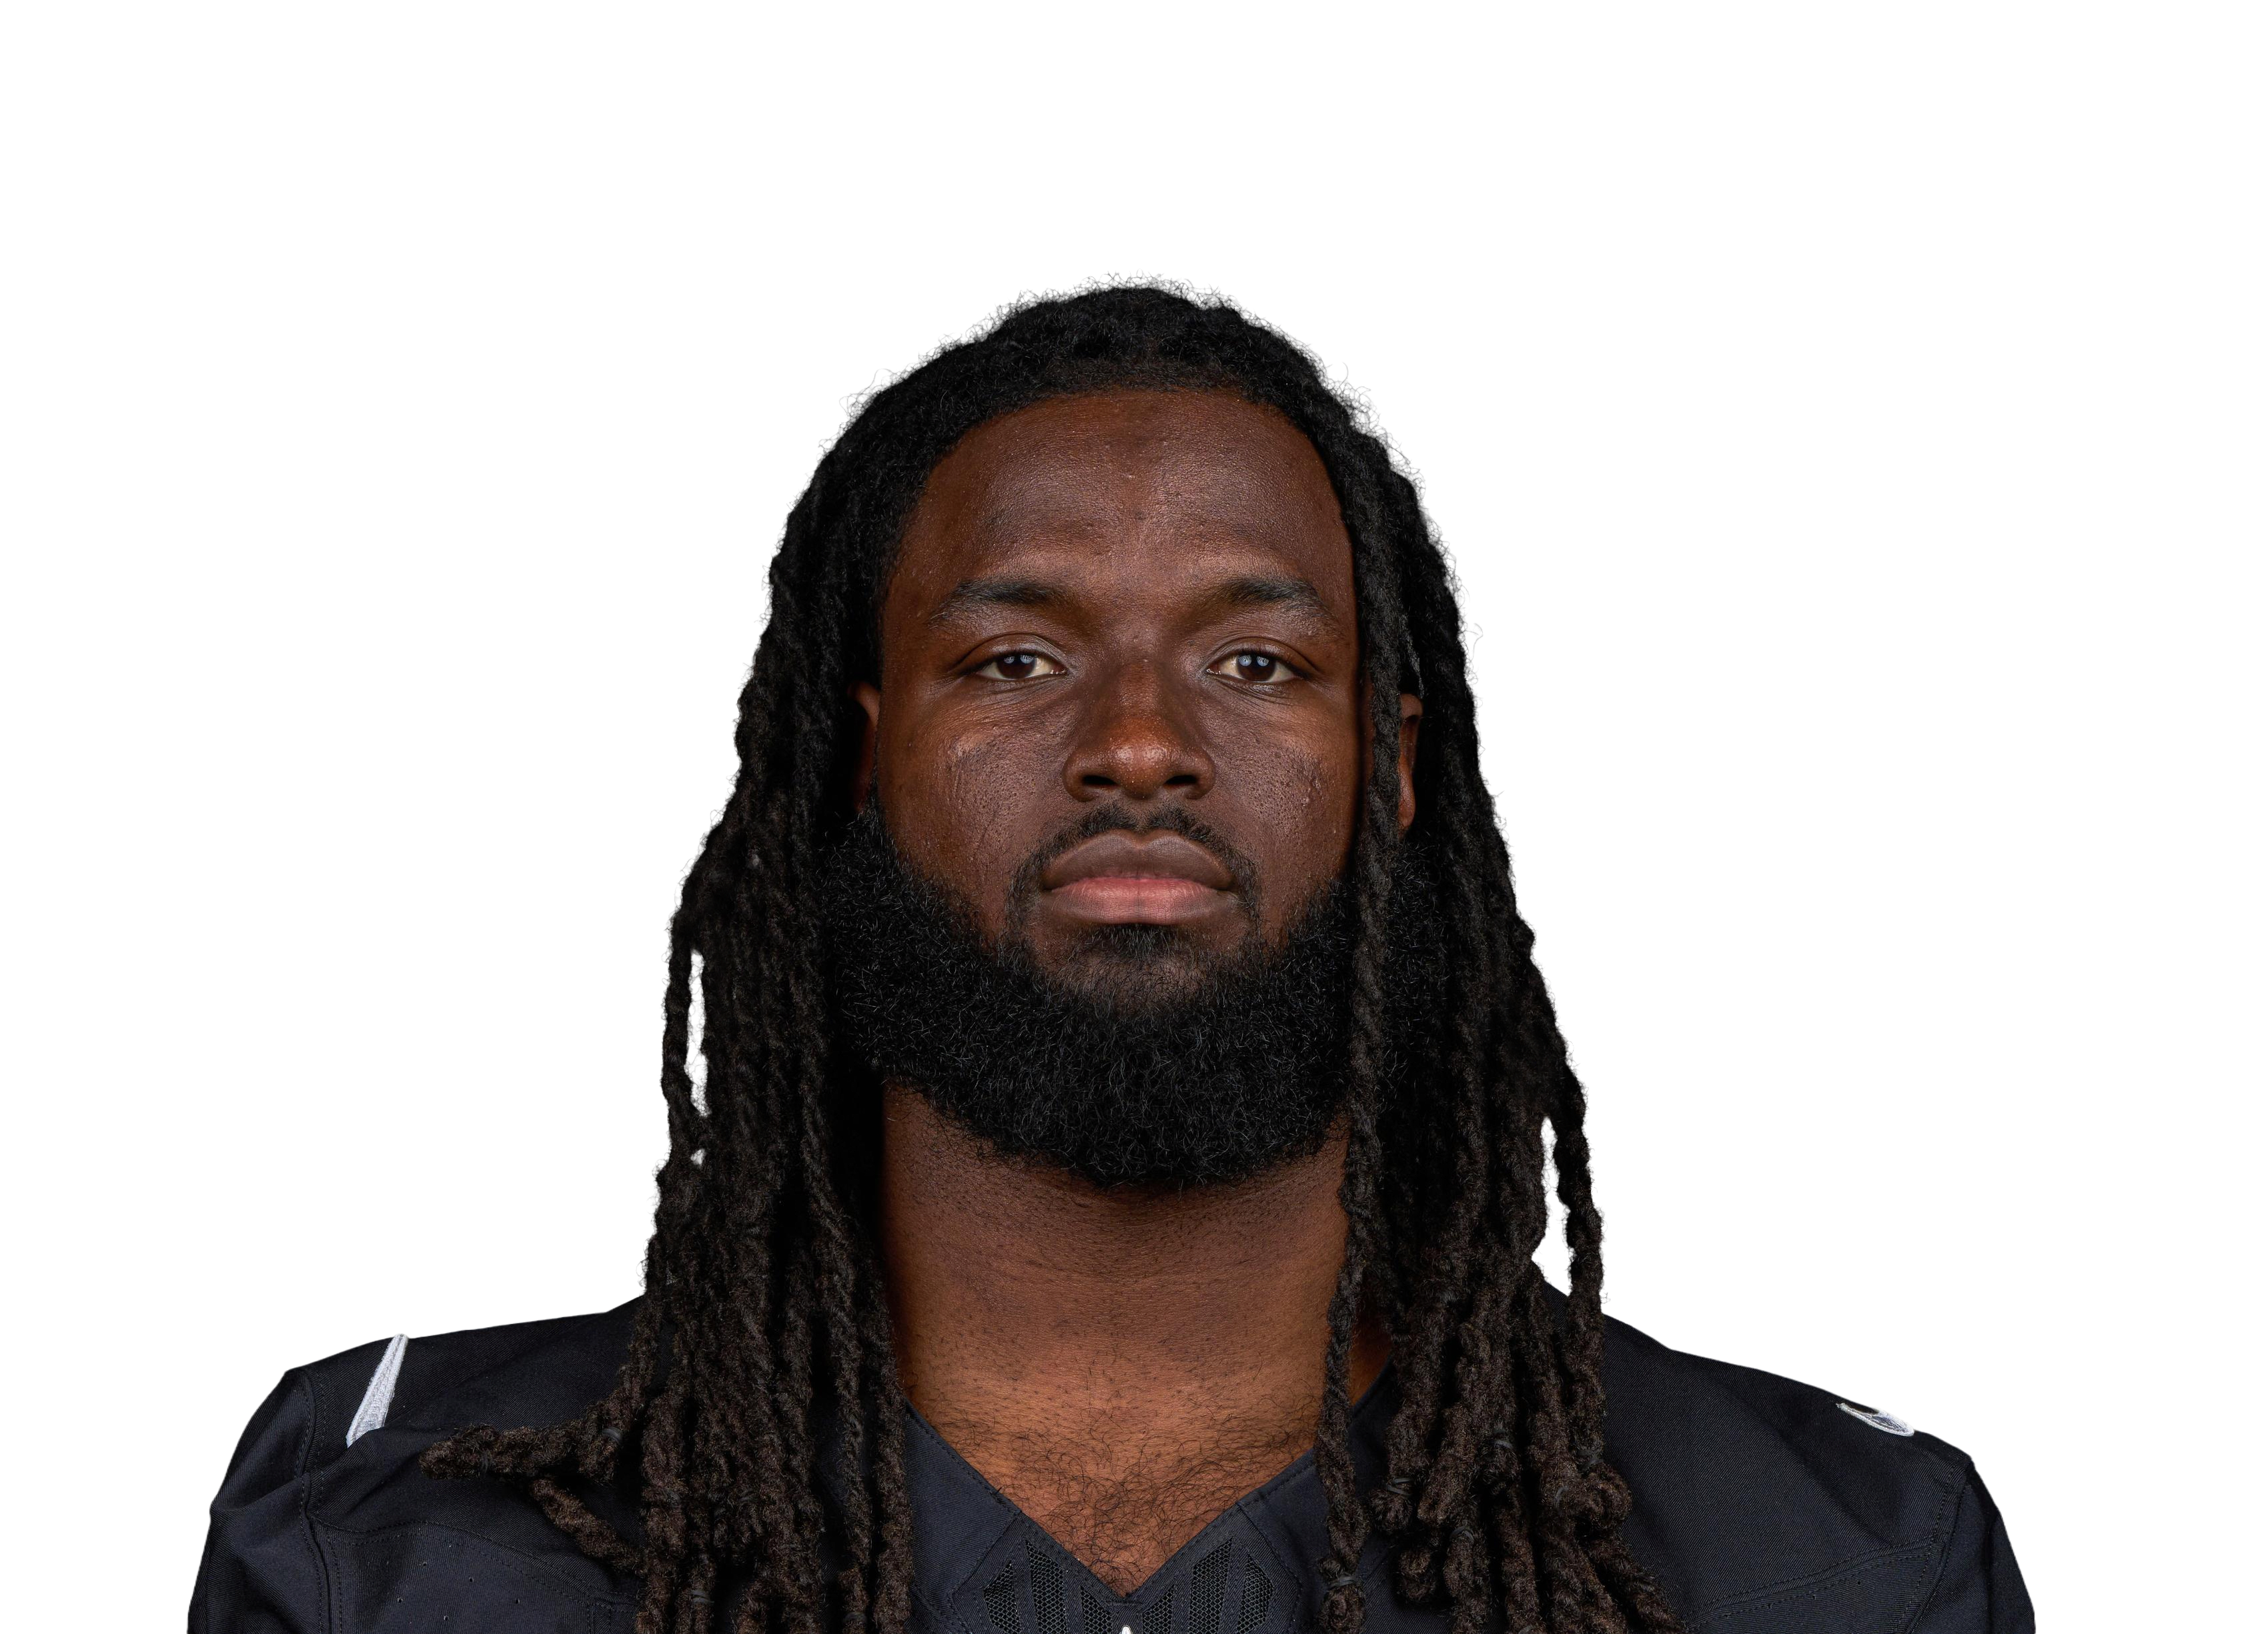 Ian Thomas
|
CAR | 13 | 41 | 11.2 | 1.5 | 2.4 | 20 | 1 | 7.2 | 64.5% | 7.2% | 0.15 | |
| 58 |
 Foster Moreau
|
LV | 8 | 49 | 17.5 | 0.9 | 1.1 | 7 | 2 | 20.0 | 77.8% | 3.3% | 0.09 | |
| 59 |
 Jesse James
|
DET | 13 | 40 | 9.9 | 1.1 | 1.7 | 14 | 2 | 9.2 | 63.6% | 5.0% | 0.10 | |
| 60 |
 Albert Okwuegbunam
|
DEN | 4 | — | 30.2 | 2.8 | 3.8 | 11 | 1 | 11.0 | 73.3% | 12.1% | 0.24 |
What this is. Finished box-score production from 2020, ranked by Rec yards. Per-game columns divide by games played, not games on the schedule, so a player who missed time is measured on the games he was in — and his season totals still show the games he missed. Minimum 4 games to be ranked, otherwise one big afternoon tops every list.
What it isn’t. None of this is a projection, a pick, or a prop recommendation — it is what already happened. Last season’s rate is a starting point for what a player does in a game, not a forecast of the next one: offense, role, and health all move underneath it. Target share and WOPR describe a player’s share of his own team’s passing game, so they compare roles, not players across teams.
About the grade. 0–100, where 50 is average for the position and 85+ is elite. It is box production, scaled by the defense it came against, pulled toward the positional average when a player has few games, then ranked within position — so a 90 quarterback and a 90 kicker are each elite for their own spot and are not comparable to each other in any other way. It needs 6 games, so players below that show — rather than a number built on a hot month.
What the grade can’t see. There is no charting behind it, so it rewards production over technique: the receiver who ran the route that freed someone else, and the back who picked up the blitz, get nothing for it. It is role-dependent by construction — a back on a run-heavy team gets more chances than an equally good back who touches it half as often. Kickers are not opponent-adjusted, because field goals are contested by distance and weather, not by the defense across the ball. And it grades a season already played; it is not a projection of the next one.
Regular season and postseason are kept separate on purpose. Playoff samples are small and the opponents are better; blending them into a season rate quietly flatters the players who got there. The grade is regular-season only, so it is not offered on the postseason split.