Players 2021 final




Wide receivers — 2021 · ranked by Rec yards
| # | Player | Tm | G | Grade | Yds/gm | Rec/gm | Tgt/gm | Rec yds | Rec | TD | Y/R | Catch% | Tgt share | WOPR |
|---|---|---|---|---|---|---|---|---|---|---|---|---|---|---|
| 1 |
Cooper Kupp
|
LAR | 17 | 92 | 114.5 | 8.5 | 11.2 | 145 | 16 | 13.4 | 75.9% | 32.3% | 0.72 | |
| 2 |
Justin Jefferson
|
MIN | 17 | 83 | 95.1 | 6.4 | 9.8 | 108 | 10 | 15.0 | 64.7% | 29.4% | 0.74 | |
| 3 |
Davante Adams
|
GB | 16 | 86 | 97.1 | 7.7 | 10.6 | 123 | 11 | 12.6 | 72.8% | 31.7% | 0.73 | |
| 4 |
Ja'Marr Chase
|
CIN | 17 | 79 | 85.6 | 4.8 | 7.5 | 81 | 13 | 18.0 | 63.3% | 23.2% | 0.60 | |
| 5 |
Deebo Samuel Sr.
|
SF | 16 | 74 | 87.8 | 4.8 | 7.6 | 77 | 6 | 18.2 | 63.6% | 26.2% | 0.59 | |
| 6 |
 Tyreek Hill
|
KC | 17 | 81 | 72.9 | 6.5 | 9.4 | 111 | 9 | 11.2 | 69.8% | 24.8% | 0.61 | |
| 7 |
 Stefon Diggs
|
BUF | 17 | 75 | 72.1 | 6.1 | 9.6 | 103 | 10 | 11.9 | 62.8% | 27.1% | 0.65 | |
| 8 |
 Tyler Lockett
|
SEA | 16 | 70 | 73.4 | 4.6 | 6.7 | 73 | 8 | 16.1 | 68.2% | 24.3% | 0.62 | |
| 9 |
 Diontae Johnson
|
PIT | 16 | 76 | 72.6 | 6.7 | 10.6 | 107 | 8 | 10.9 | 63.3% | 27.9% | 0.65 | |
| 10 |
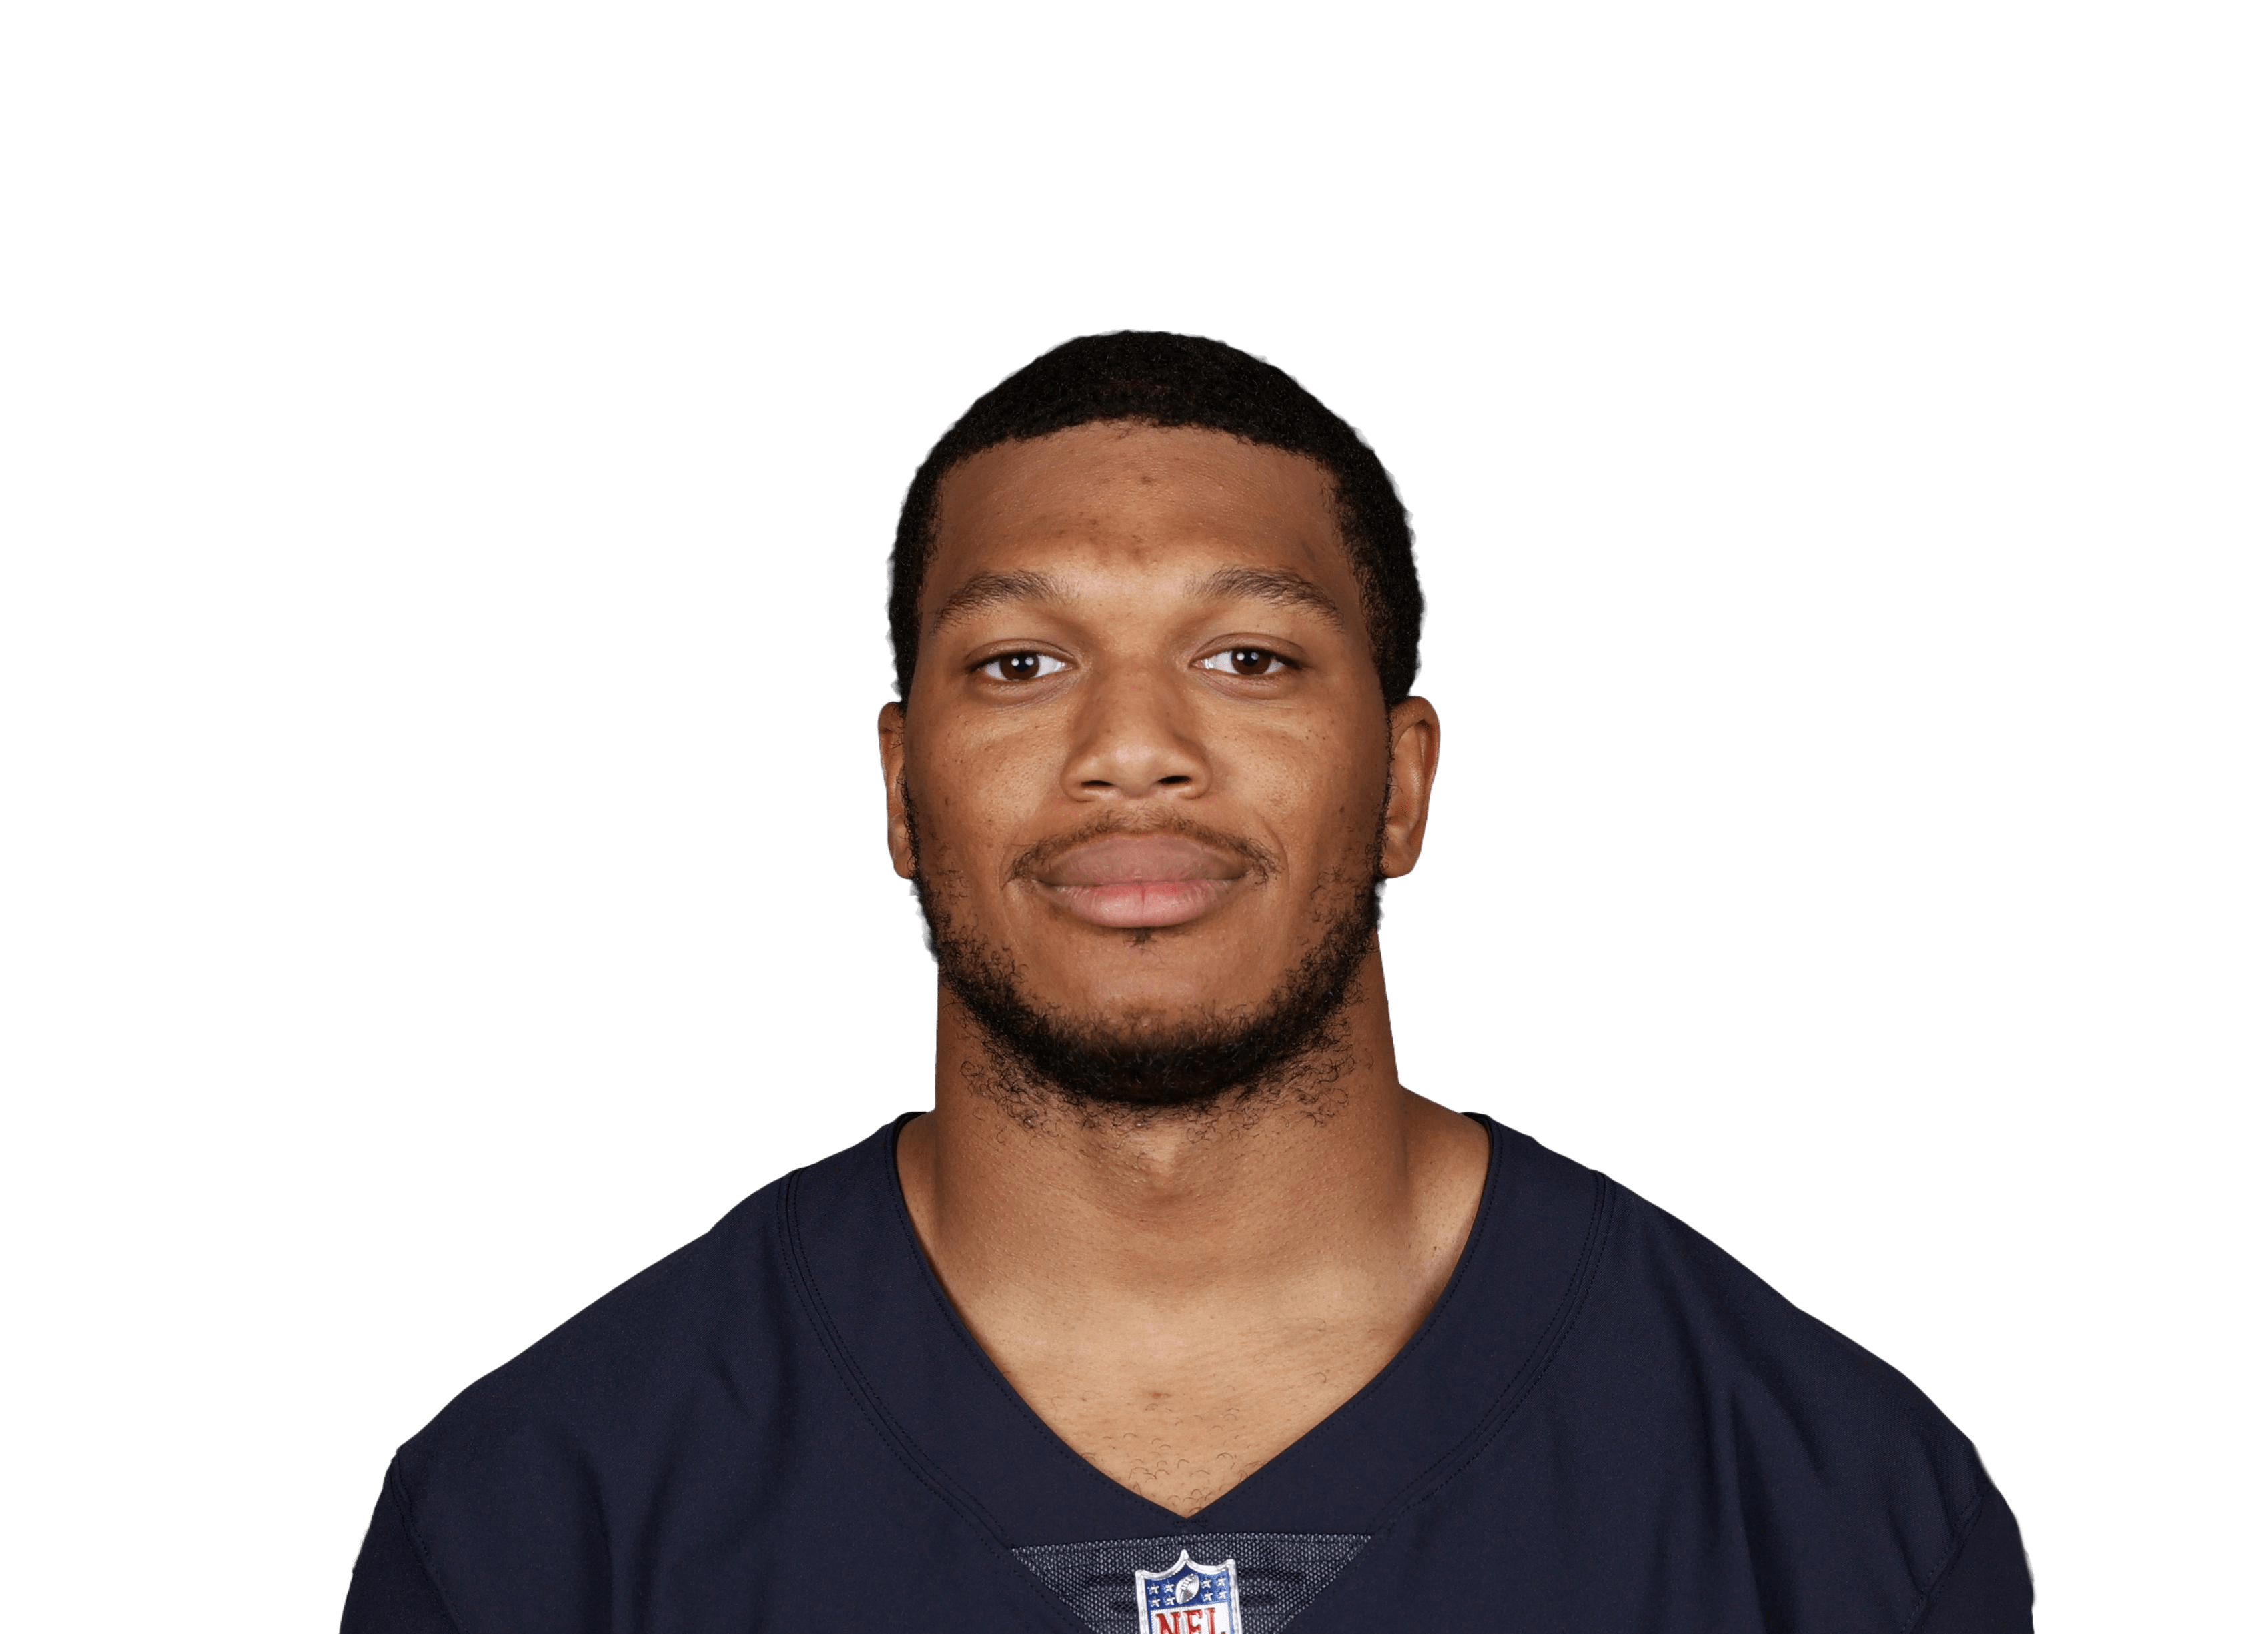 DJ Moore
|
CAR | 17 | 67 | 68.1 | 5.5 | 9.6 | 93 | 4 | 12.4 | 57.1% | 28.5% | 0.71 | |
| 11 |
 Mike Williams
|
LAC | 16 | 72 | 71.6 | 4.8 | 8.1 | 76 | 9 | 15.1 | 58.9% | 20.1% | 0.50 | |
| 12 |
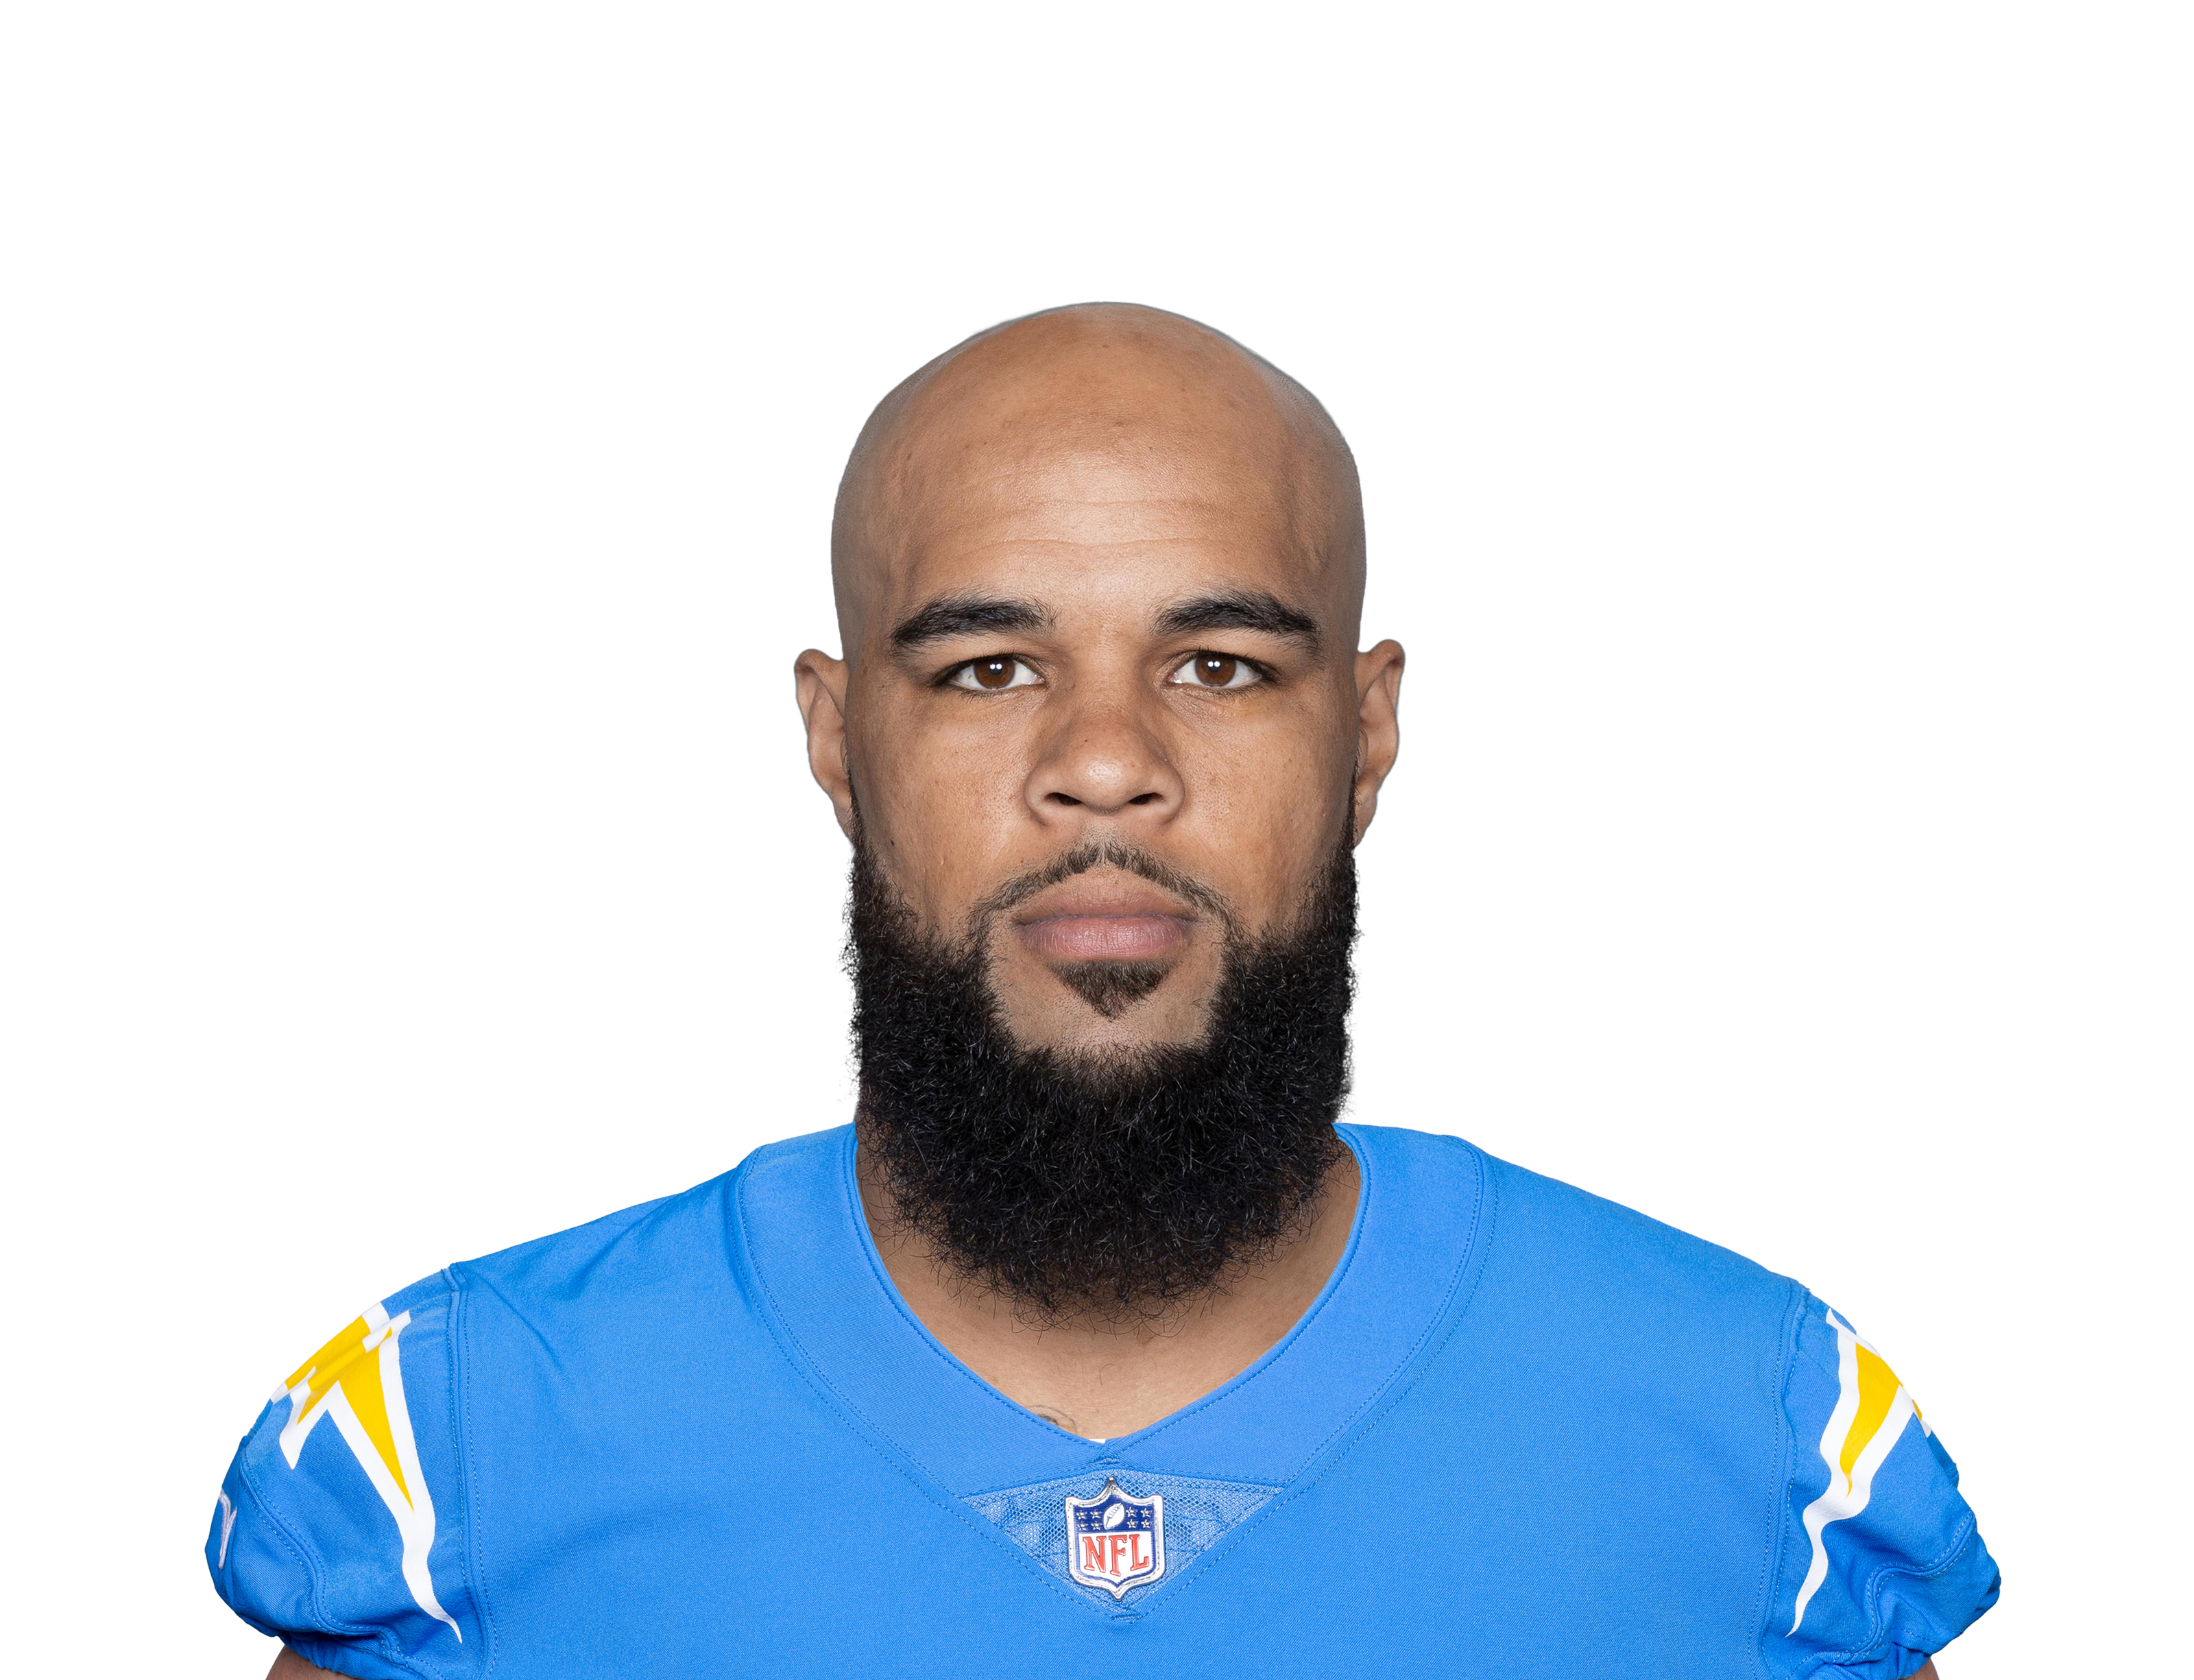 Keenan Allen
|
LAC | 16 | 74 | 71.1 | 6.6 | 9.8 | 106 | 6 | 10.7 | 67.5% | 25.7% | 0.59 | |
| 13 |
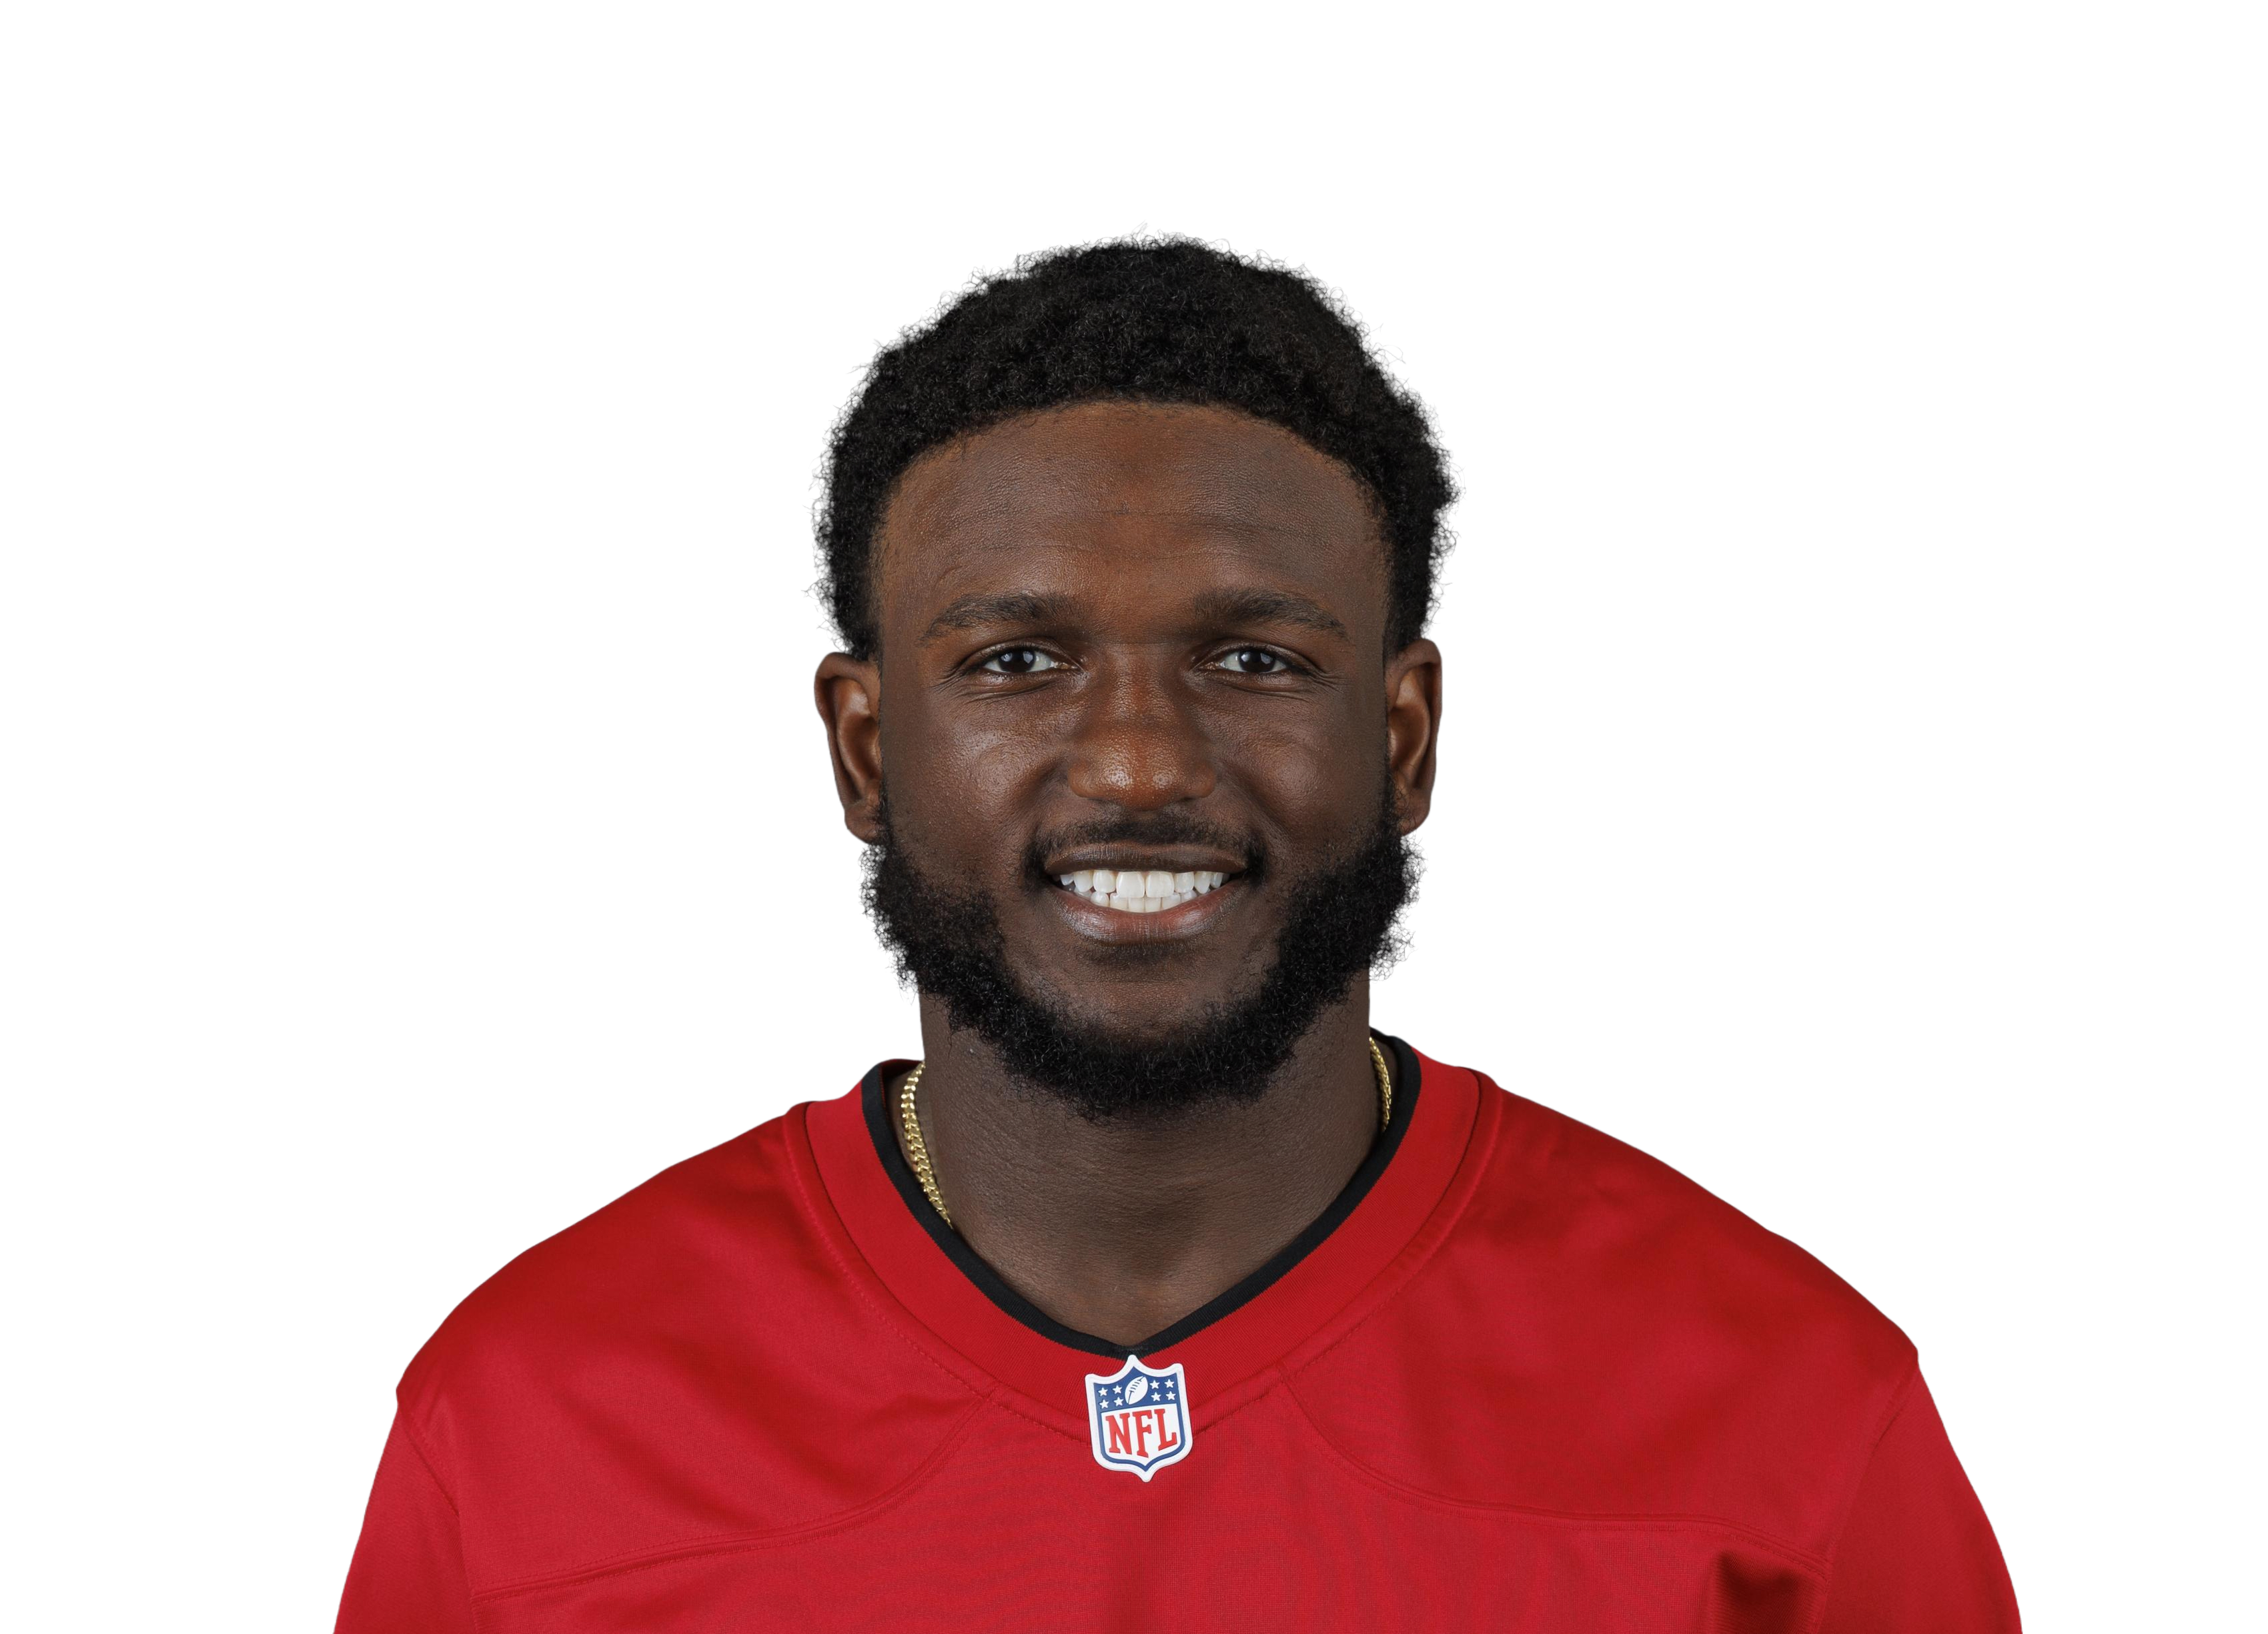 Chris Godwin Jr.
|
TB | 14 | 78 | 78.8 | 7.0 | 9.1 | 98 | 5 | 11.3 | 77.2% | 21.1% | 0.45 | |
| 14 |
 CeeDee Lamb
|
DAL | 16 | 69 | 68.9 | 4.9 | 7.5 | 79 | 6 | 13.9 | 65.8% | 20.1% | 0.48 | |
| 15 |
 Tee Higgins
|
CIN | 14 | 70 | 77.9 | 5.3 | 7.9 | 74 | 6 | 14.7 | 67.3% | 23.5% | 0.59 | |
| 16 |
 Michael Pittman
|
IND | 17 | 66 | 63.6 | 5.2 | 7.6 | 88 | 6 | 12.3 | 68.2% | 26.1% | 0.62 | |
| 17 |
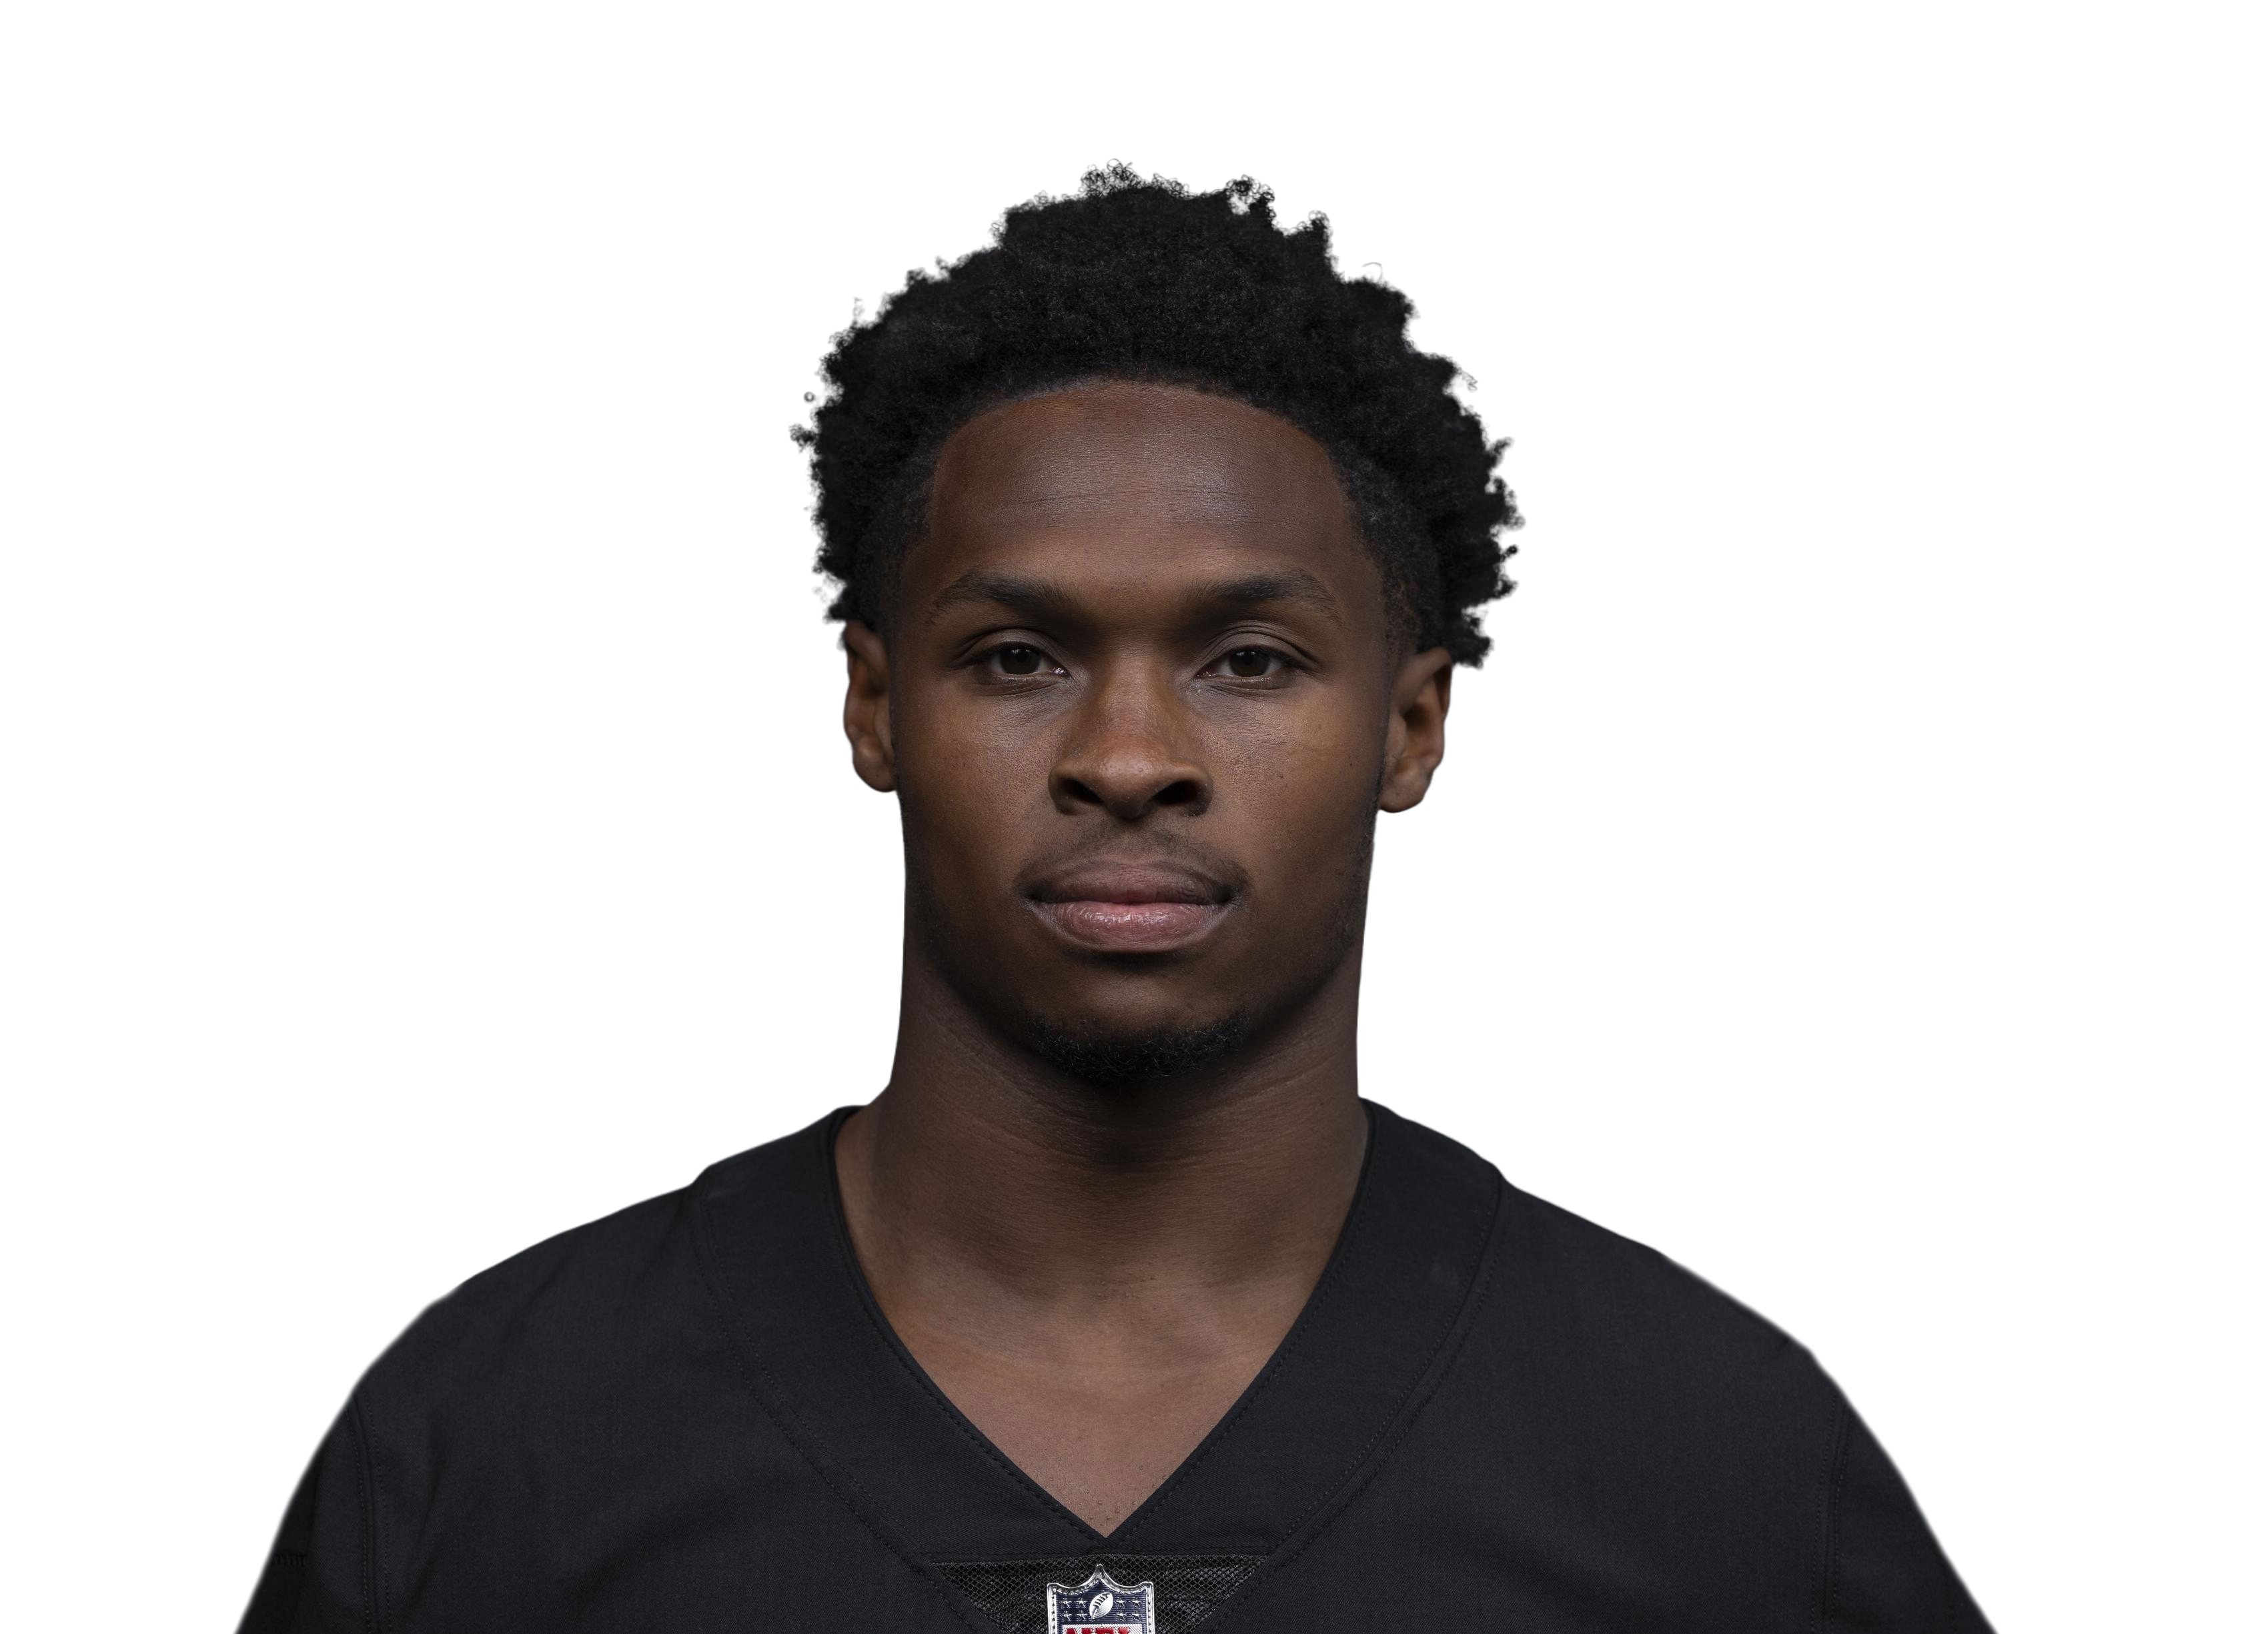 Darnell Mooney
|
CHI | 17 | 63 | 62.1 | 4.8 | 8.2 | 81 | 4 | 13.0 | 57.9% | 27.2% | 0.65 | |
| 18 |
 Terry McLaurin
|
WAS | 17 | 65 | 61.9 | 4.5 | 7.6 | 77 | 5 | 13.7 | 59.2% | 24.6% | 0.66 | |
| 19 |
 Hunter Renfrow
|
LV | 17 | 72 | 61.1 | 6.1 | 7.5 | 103 | 9 | 10.1 | 80.5% | 21.0% | 0.43 | |
| 20 |
 Brandin Cooks
|
HOU | 16 | 69 | 64.8 | 5.6 | 8.4 | 90 | 6 | 11.5 | 67.2% | 27.2% | 0.67 | |
| 21 |
 Mike Evans
|
TB | 16 | 77 | 64.7 | 4.6 | 7.1 | 74 | 14 | 14.0 | 64.9% | 16.7% | 0.43 | |
| 22 |
 Jaylen Waddle
|
MIA | 16 | 73 | 63.4 | 6.5 | 8.8 | 104 | 6 | 9.8 | 74.3% | 24.9% | 0.55 | |
| 23 |
 Marquise Brown
|
BAL | 16 | 68 | 63.0 | 5.7 | 9.1 | 91 | 6 | 11.1 | 62.3% | 26.3% | 0.61 | |
| 24 |
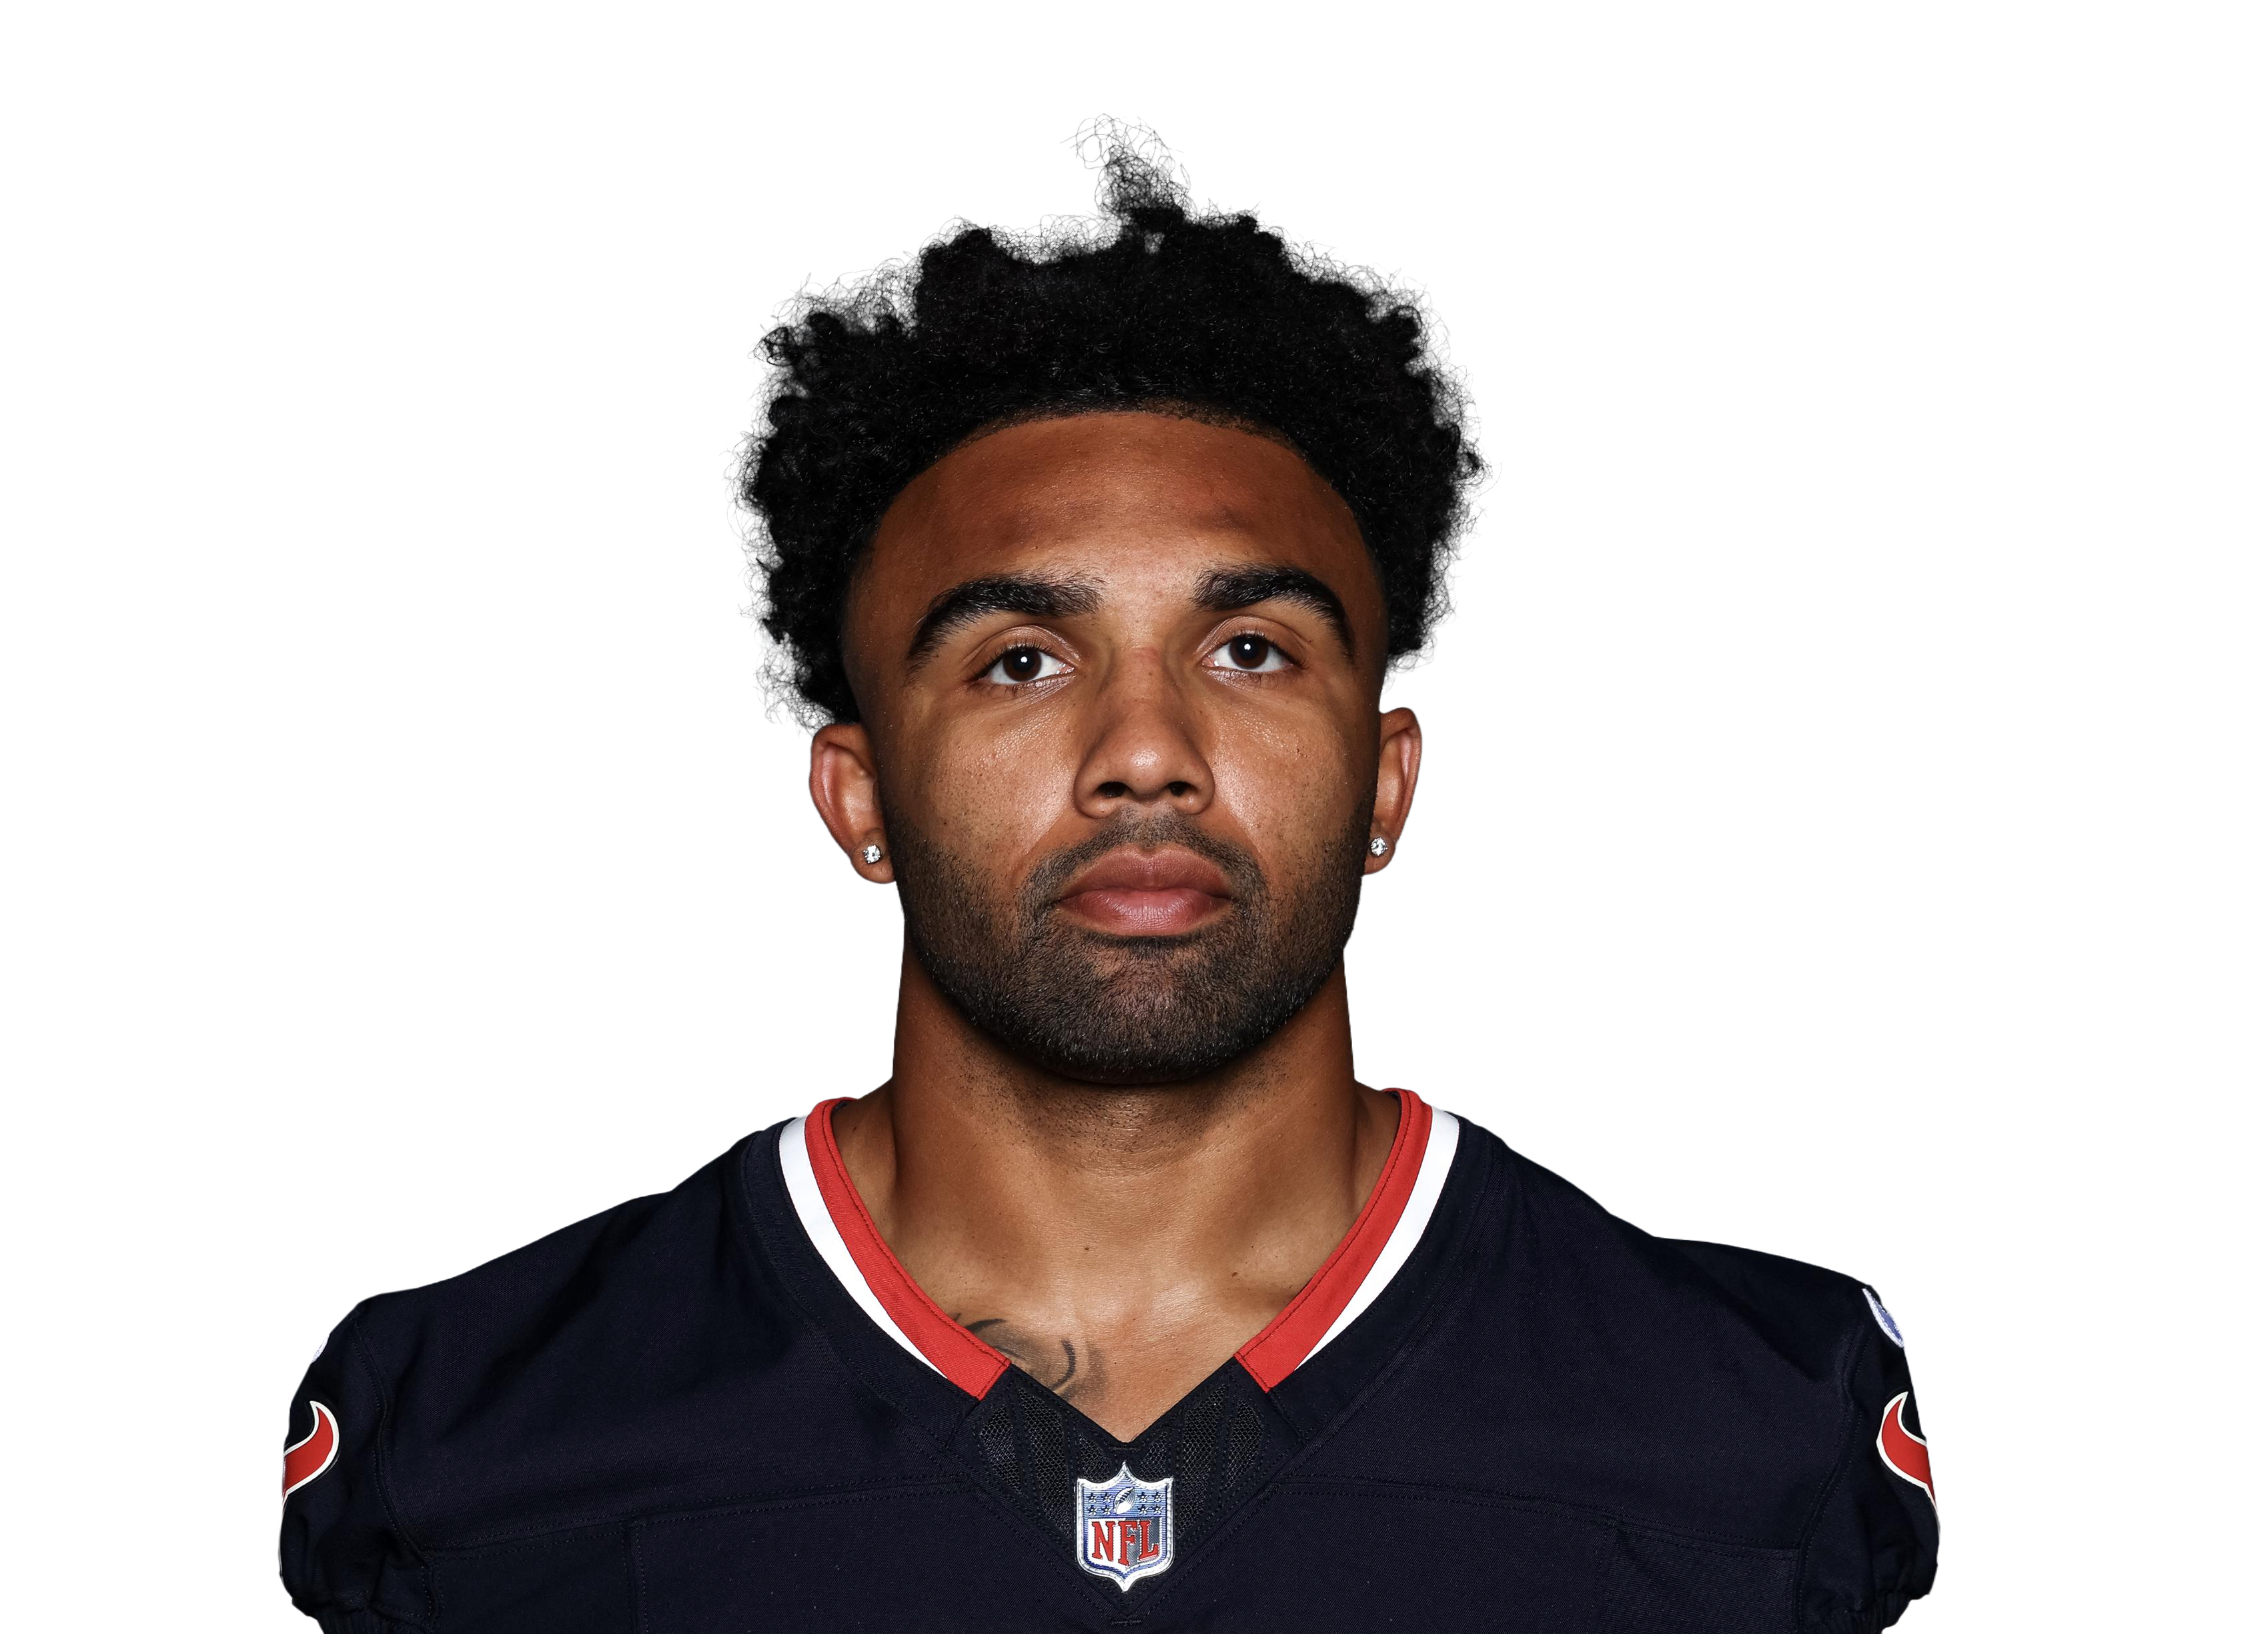 Christian Kirk
|
ARI | 17 | 64 | 57.8 | 4.5 | 6.1 | 77 | 5 | 12.8 | 74.8% | 18.4% | 0.47 | |
| 25 |
 DK Metcalf
|
SEA | 17 | 68 | 56.9 | 4.4 | 7.6 | 75 | 12 | 12.9 | 58.1% | 27.7% | 0.67 | |
| 26 |
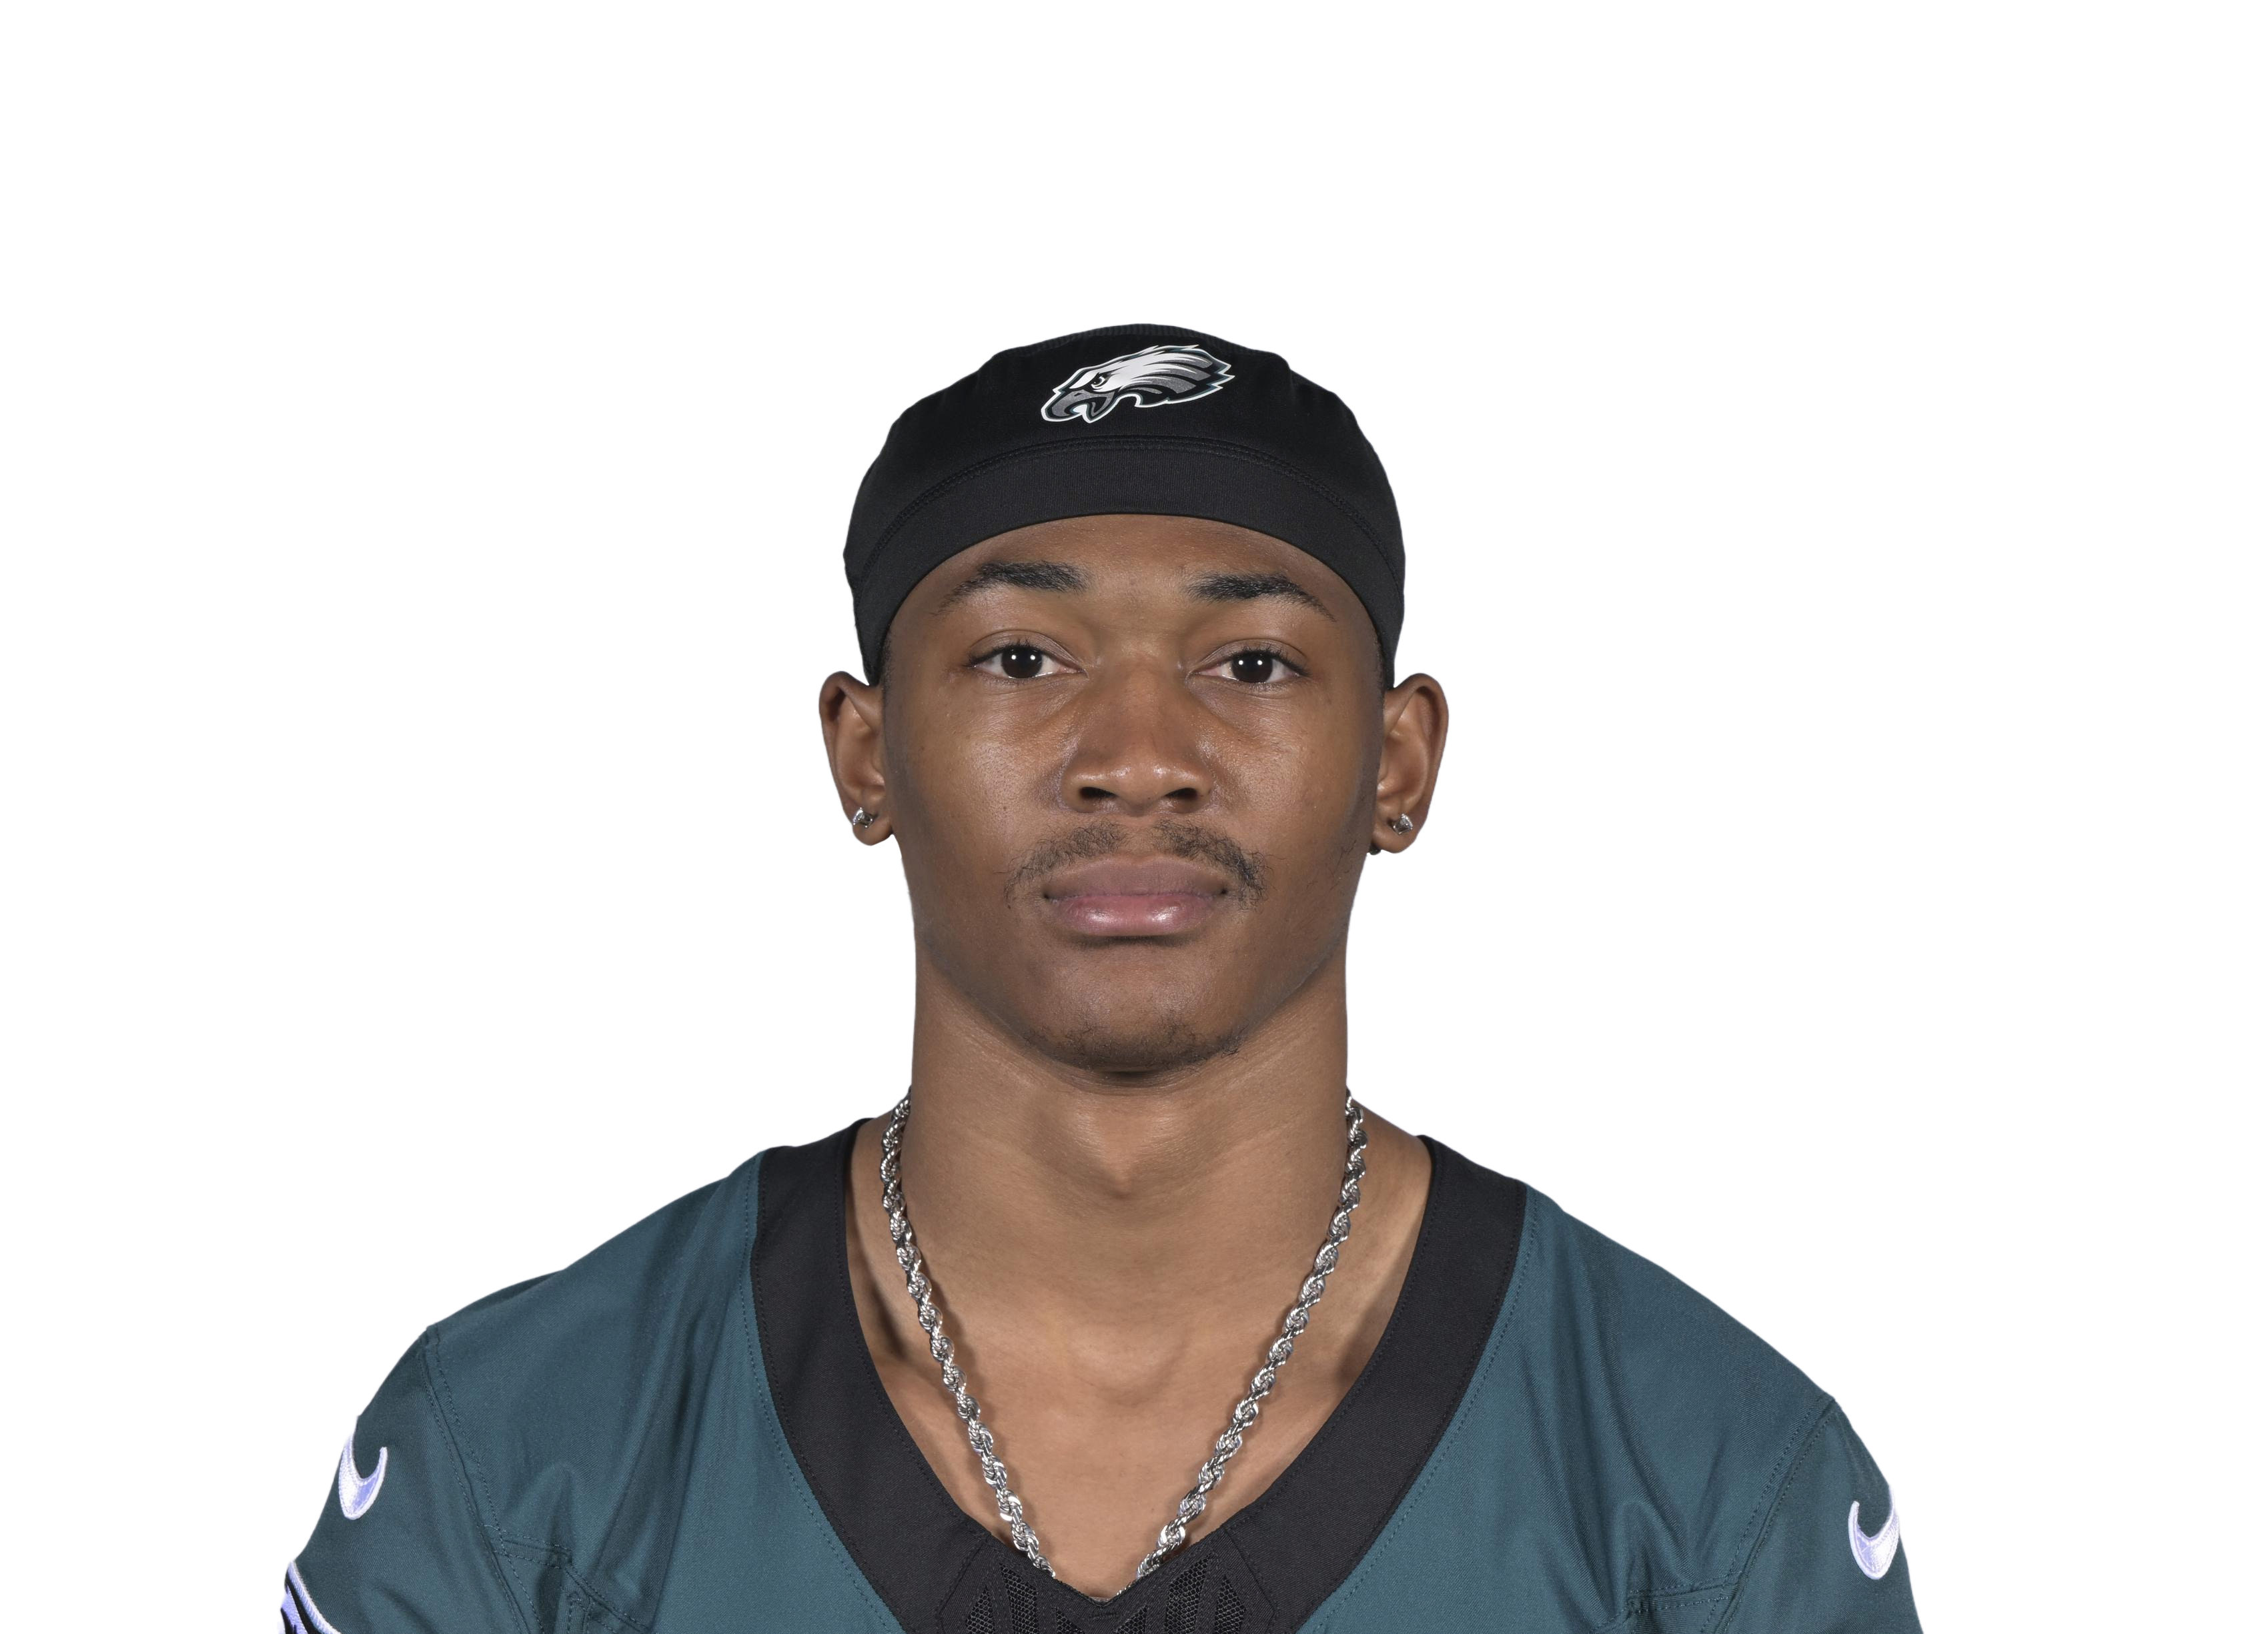 DeVonta Smith
|
PHI | 17 | 62 | 53.9 | 3.8 | 6.1 | 64 | 5 | 14.3 | 61.5% | 22.7% | 0.59 | |
| 27 |
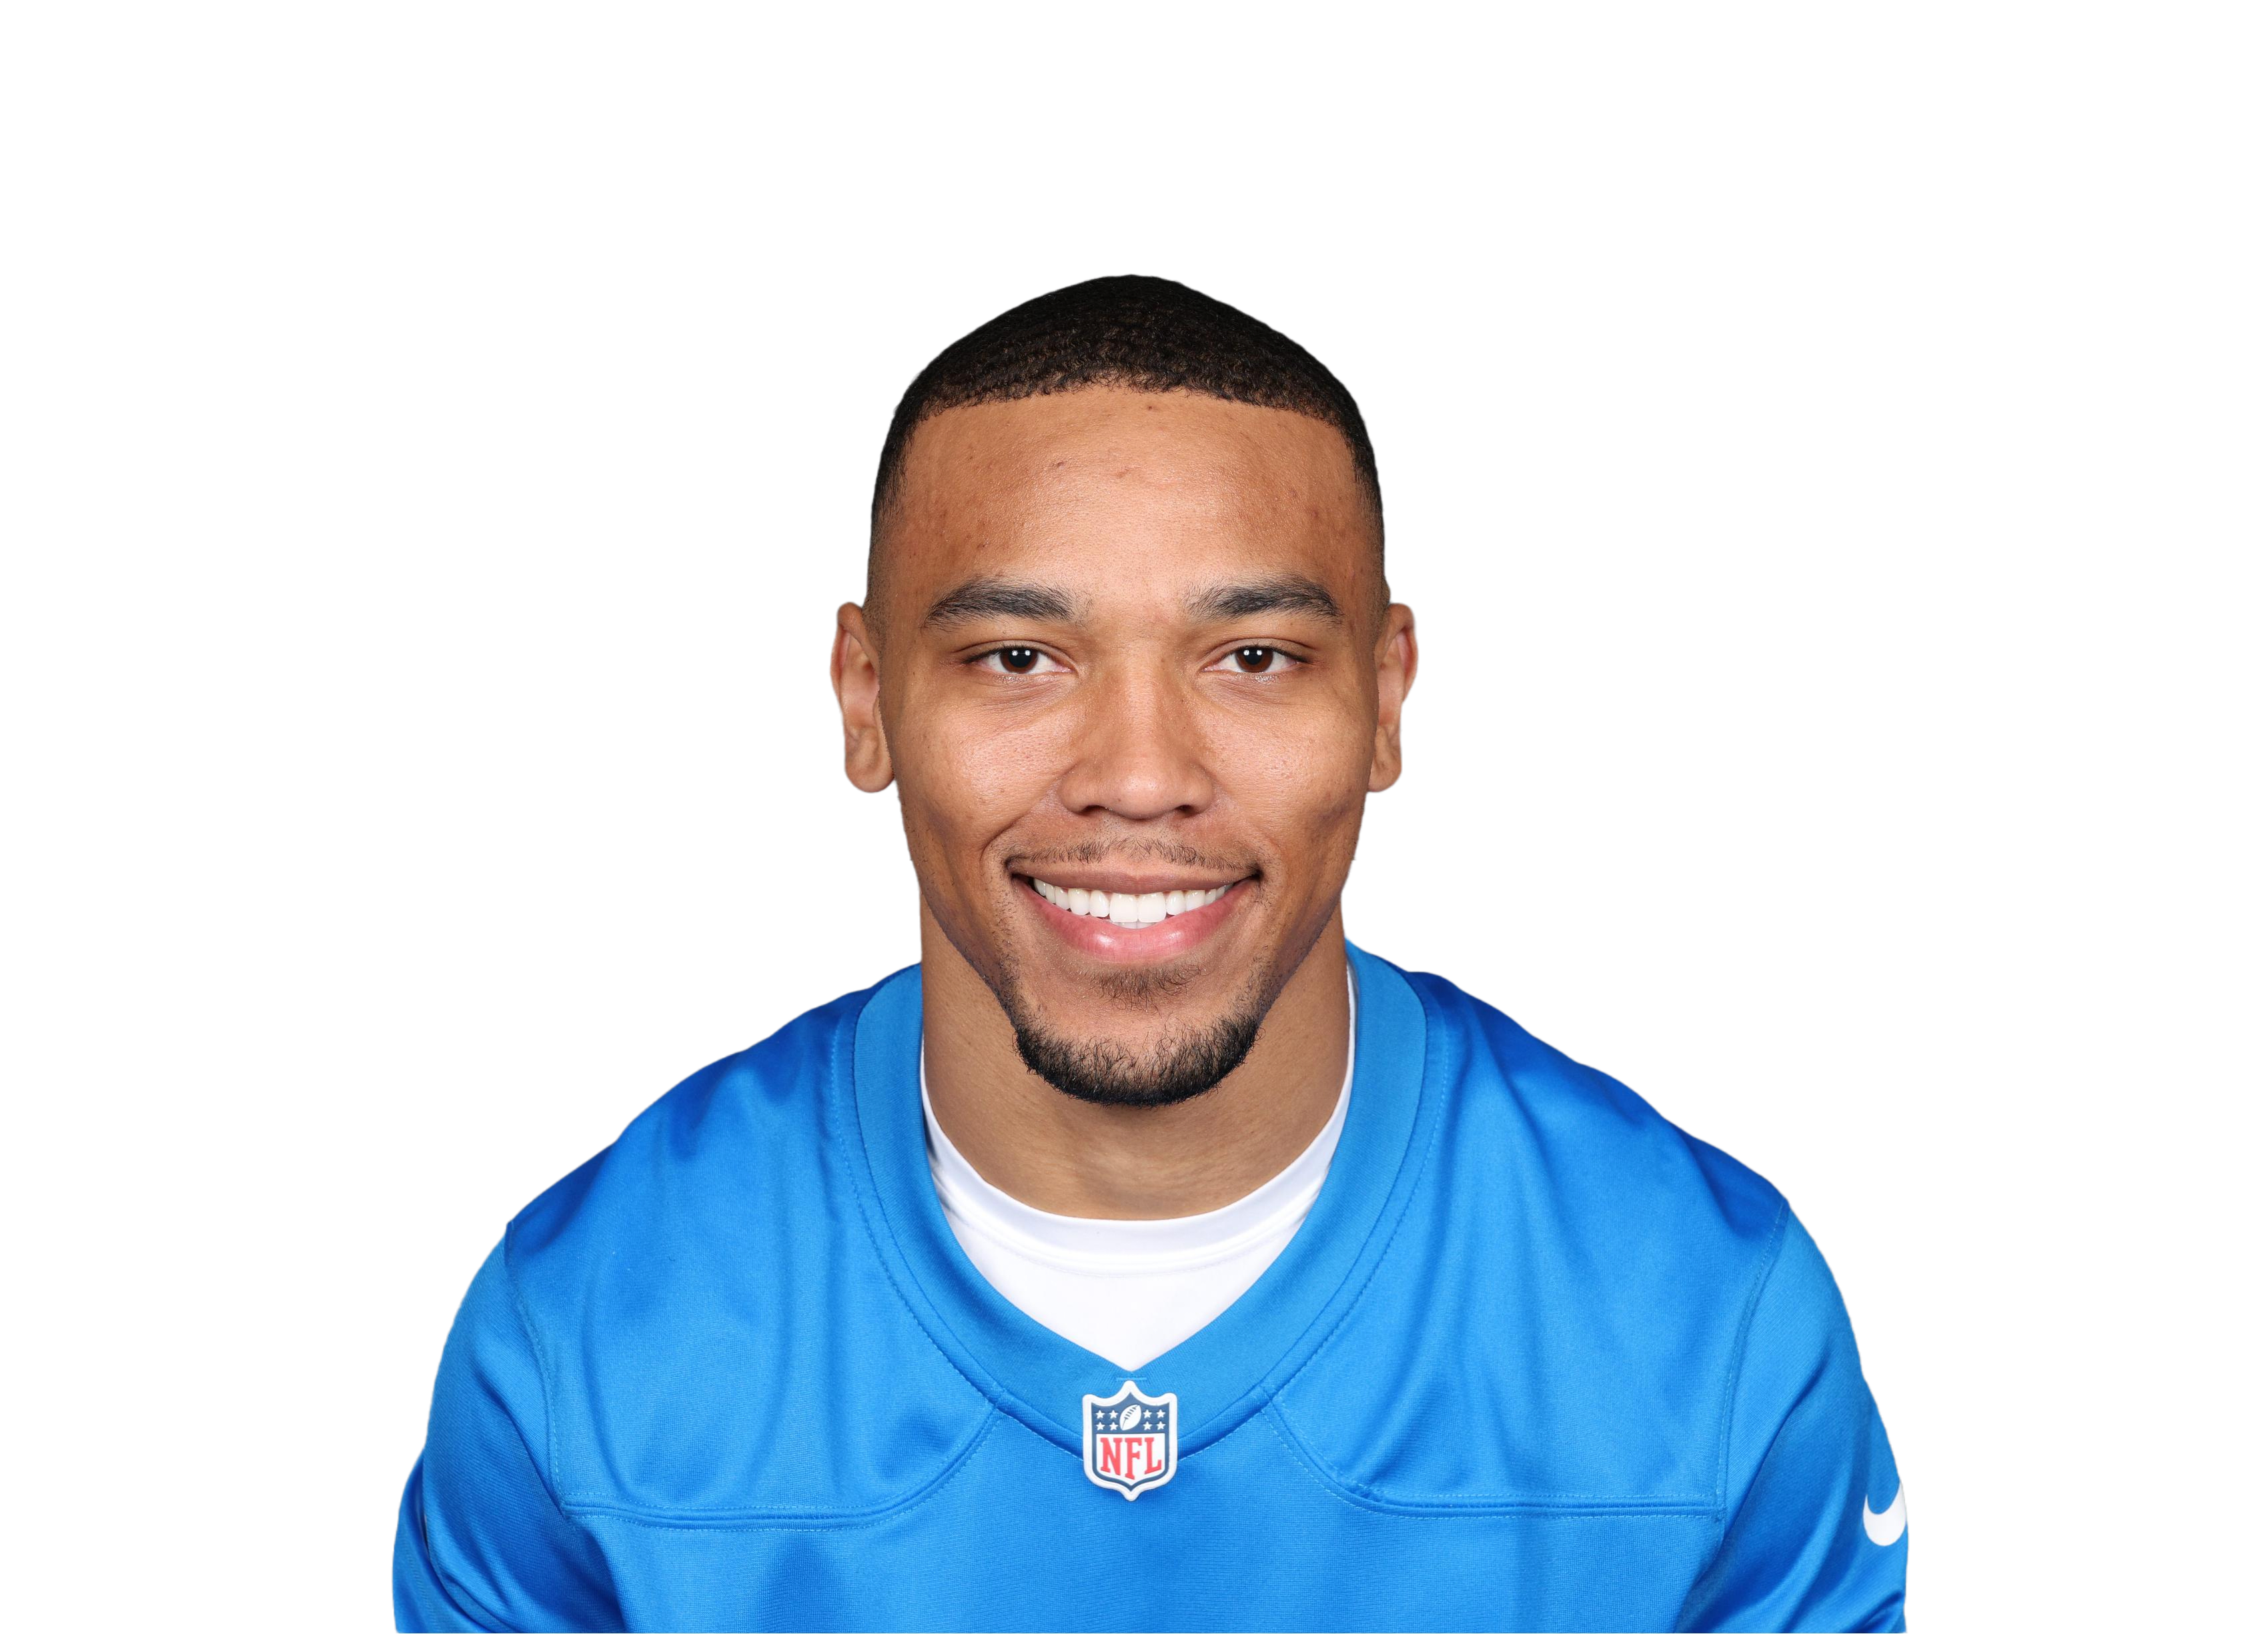 Amon-Ra St. Brown
|
DET | 16 | 66 | 57.0 | 5.6 | 7.4 | 90 | 5 | 10.1 | 75.6% | 22.8% | 0.50 | |
| 28 |
 A.J. Brown
|
TEN | 13 | 67 | 66.8 | 4.8 | 8.1 | 63 | 5 | 13.8 | 60.0% | 27.7% | 0.71 | |
| 29 |
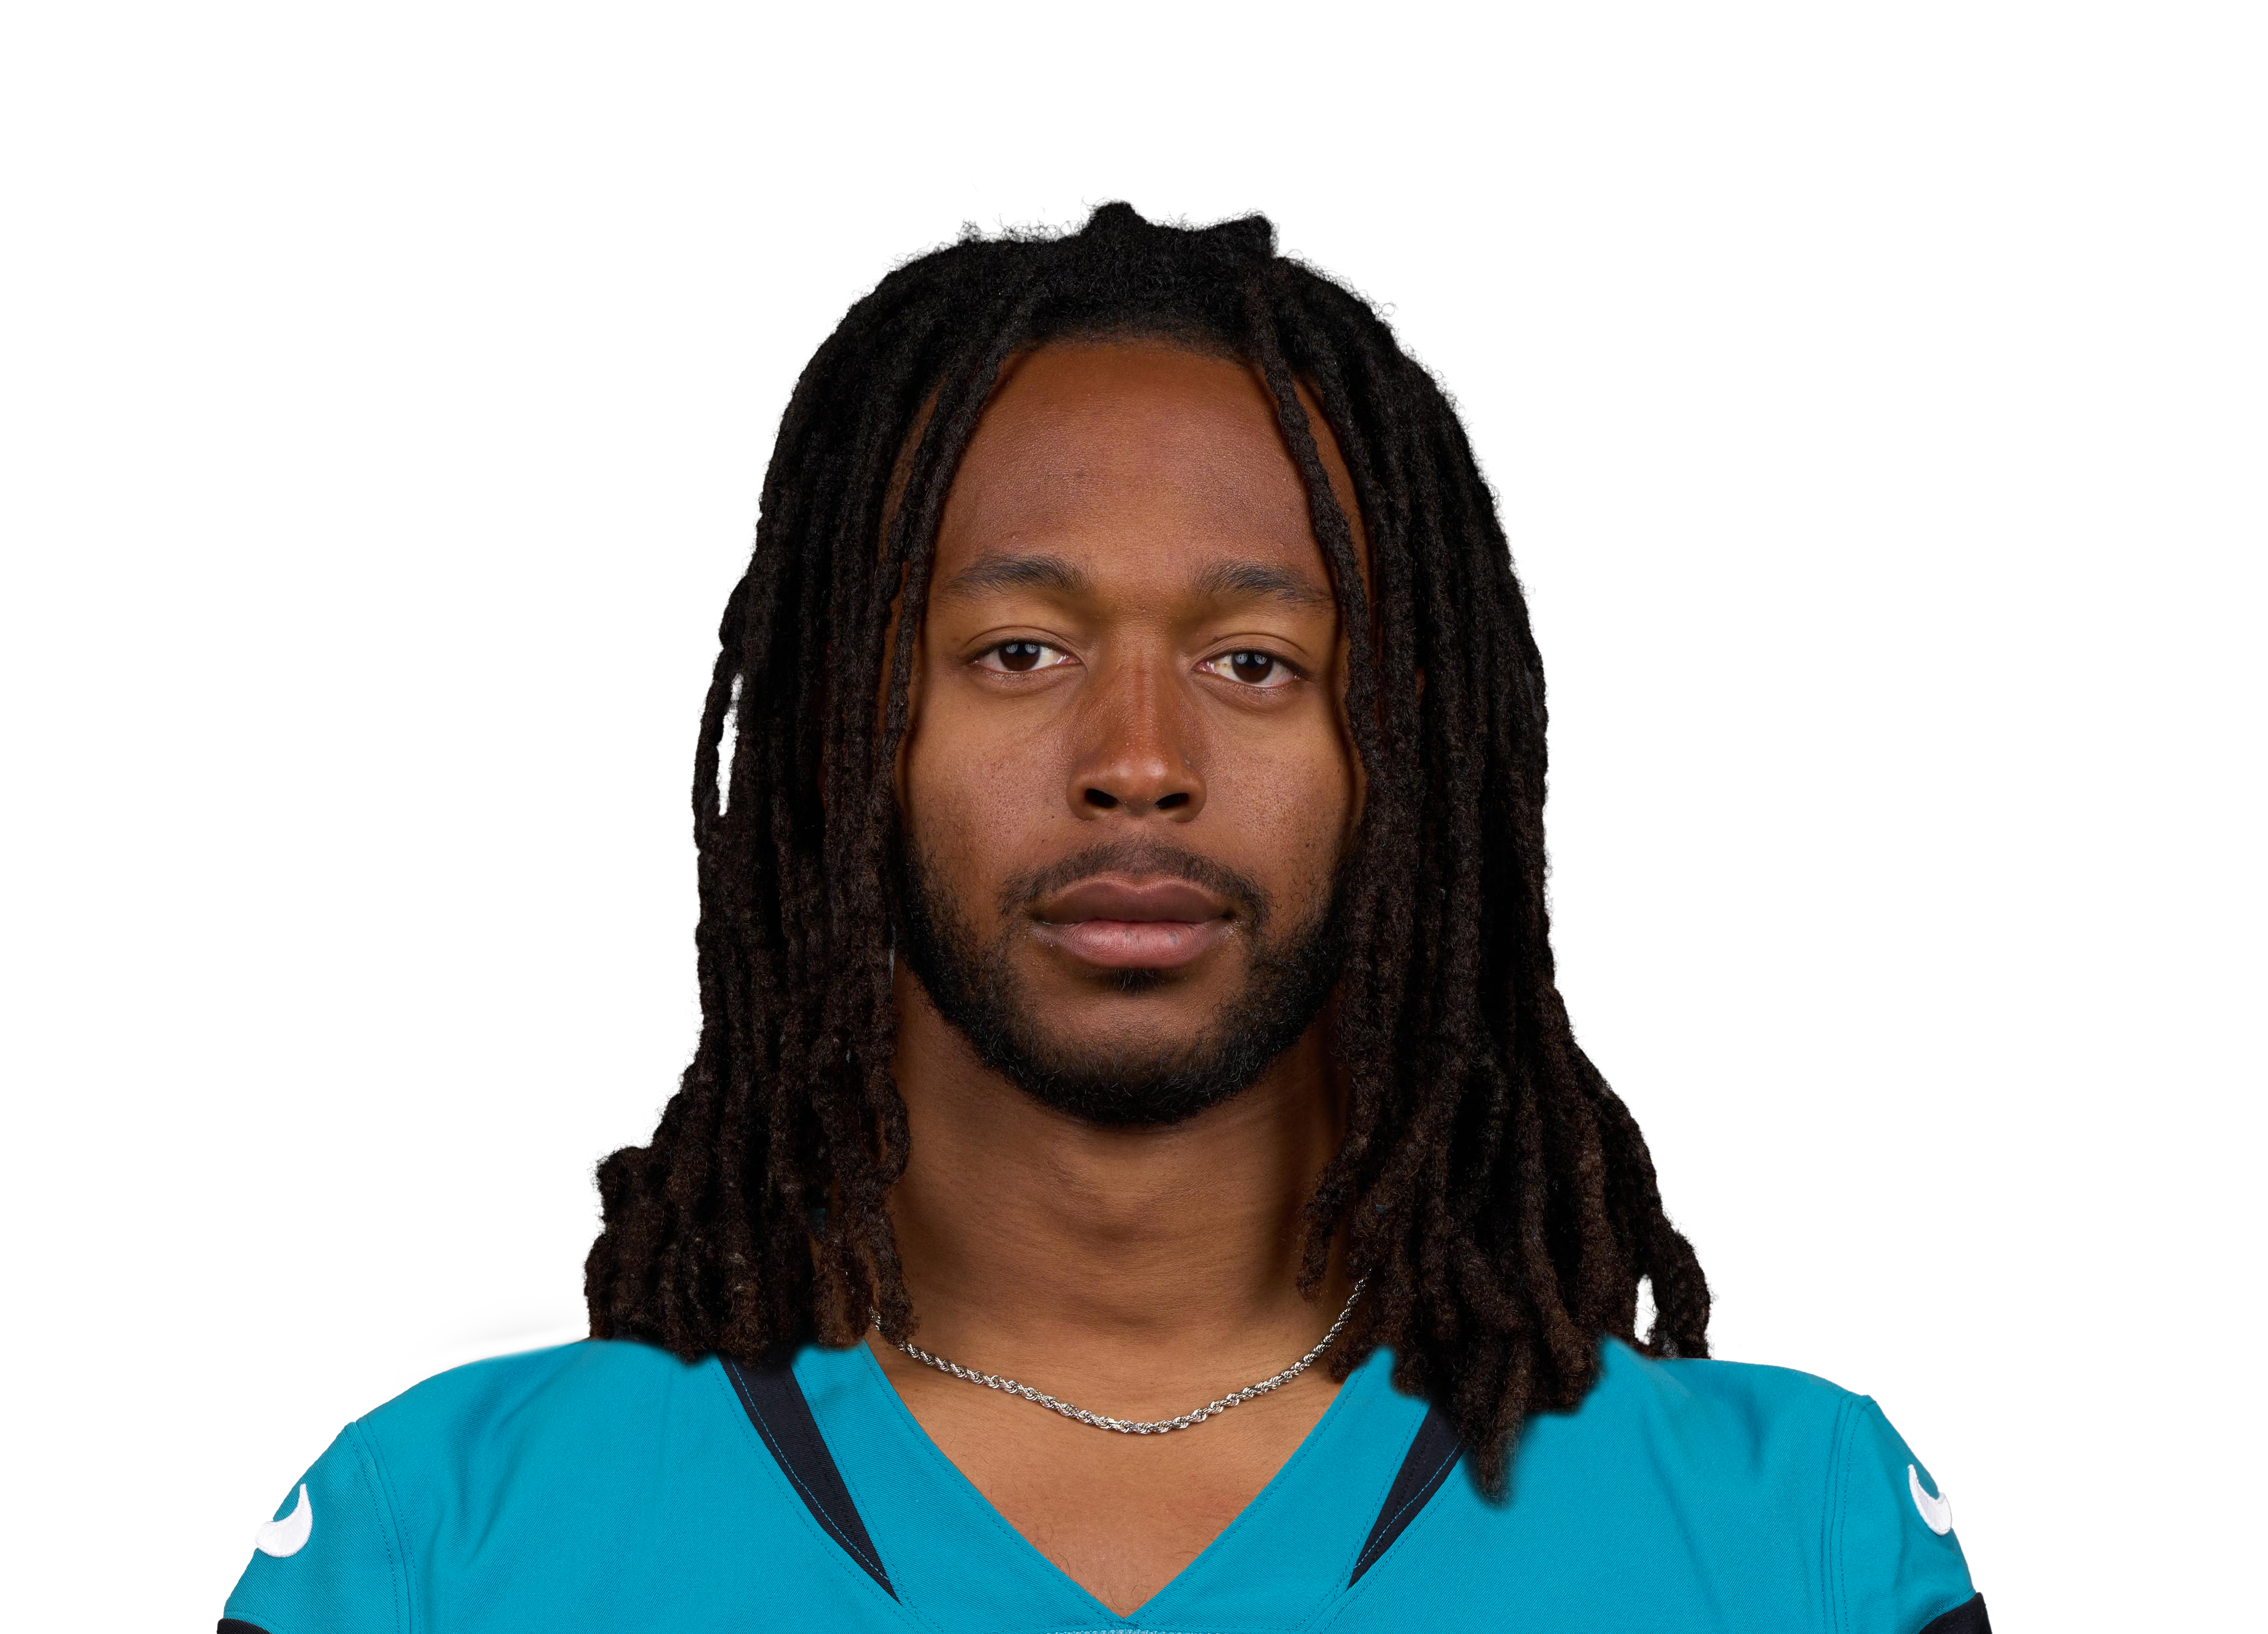 Jakobi Meyers
|
NE | 16 | 63 | 54.1 | 5.2 | 7.9 | 83 | 2 | 10.4 | 65.9% | 23.9% | 0.57 | |
| 30 |
 Amari Cooper
|
DAL | 15 | 65 | 57.7 | 4.5 | 6.9 | 68 | 8 | 12.7 | 65.4% | 18.4% | 0.45 | |
| 31 |
 Chase Claypool
|
PIT | 15 | 61 | 57.3 | 3.9 | 7.0 | 59 | 2 | 14.6 | 56.2% | 18.0% | 0.48 | |
| 32 |
 A.J. Green
|
ARI | 16 | 58 | 53.0 | 3.4 | 5.8 | 54 | 3 | 15.7 | 58.7% | 16.5% | 0.43 | |
| 33 |
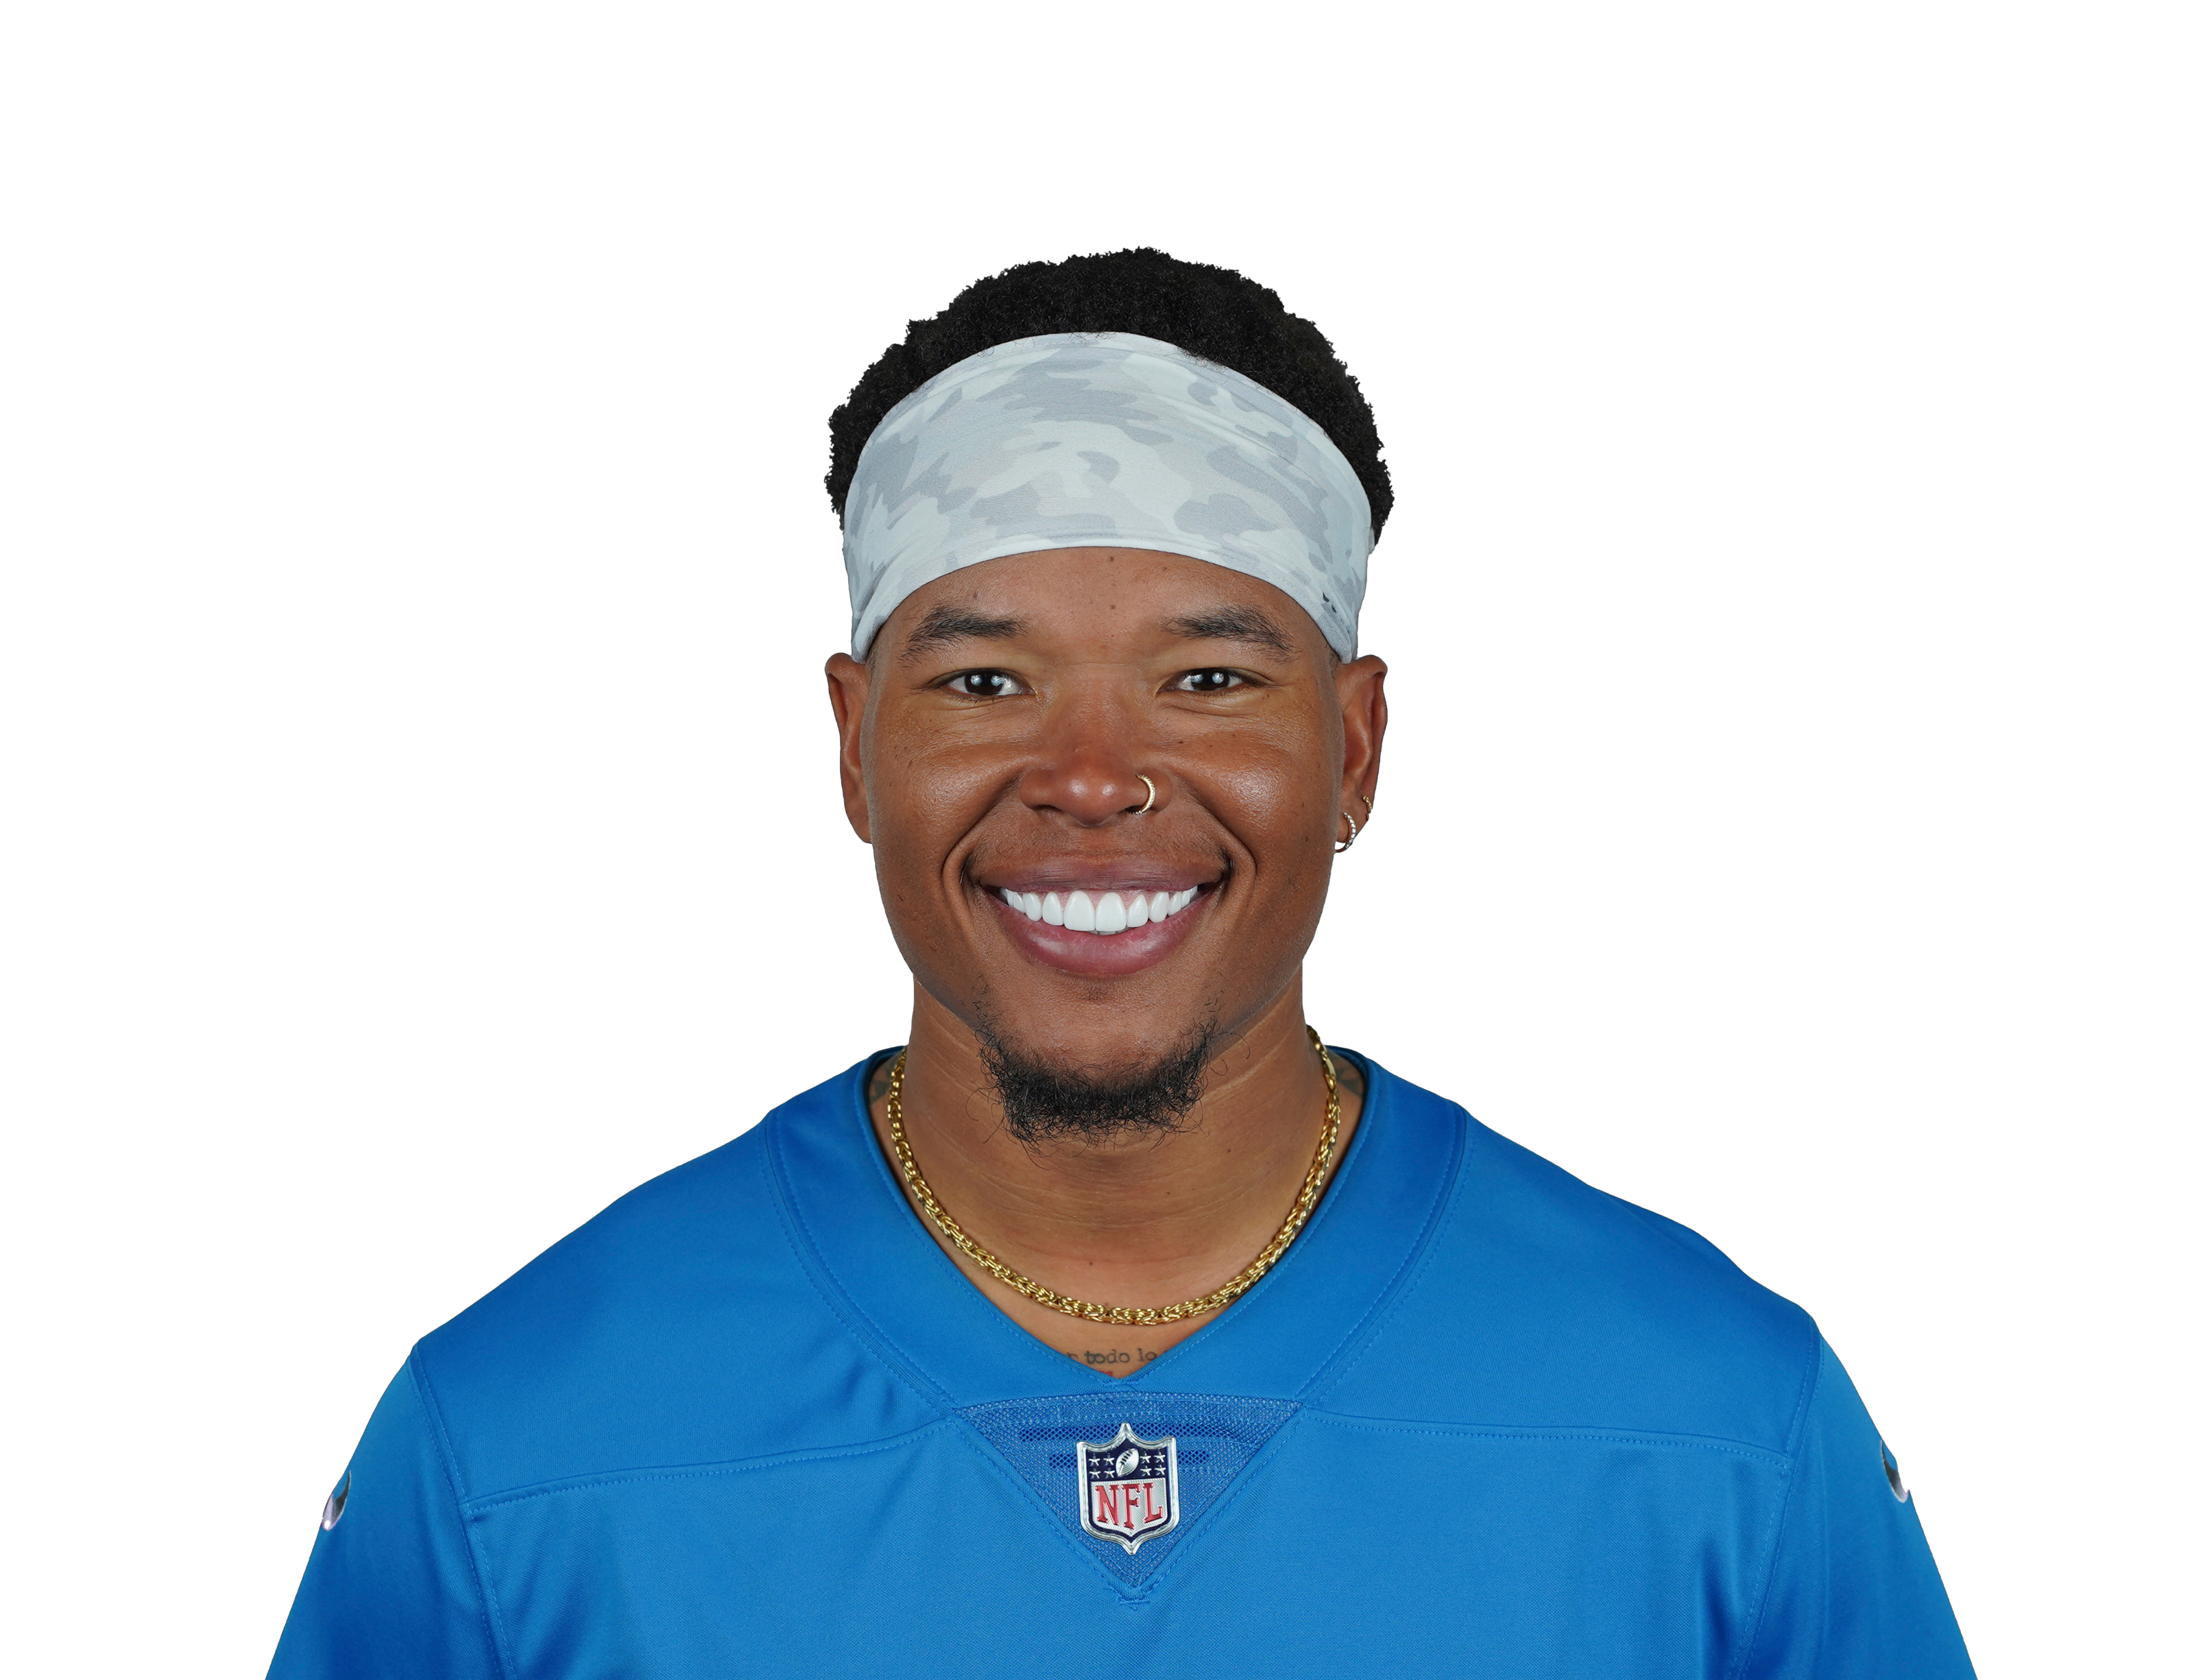 Marvin Jones
|
JAX | 17 | 61 | 48.9 | 4.3 | 7.1 | 73 | 4 | 11.4 | 60.8% | 20.7% | 0.52 | |
| 34 |
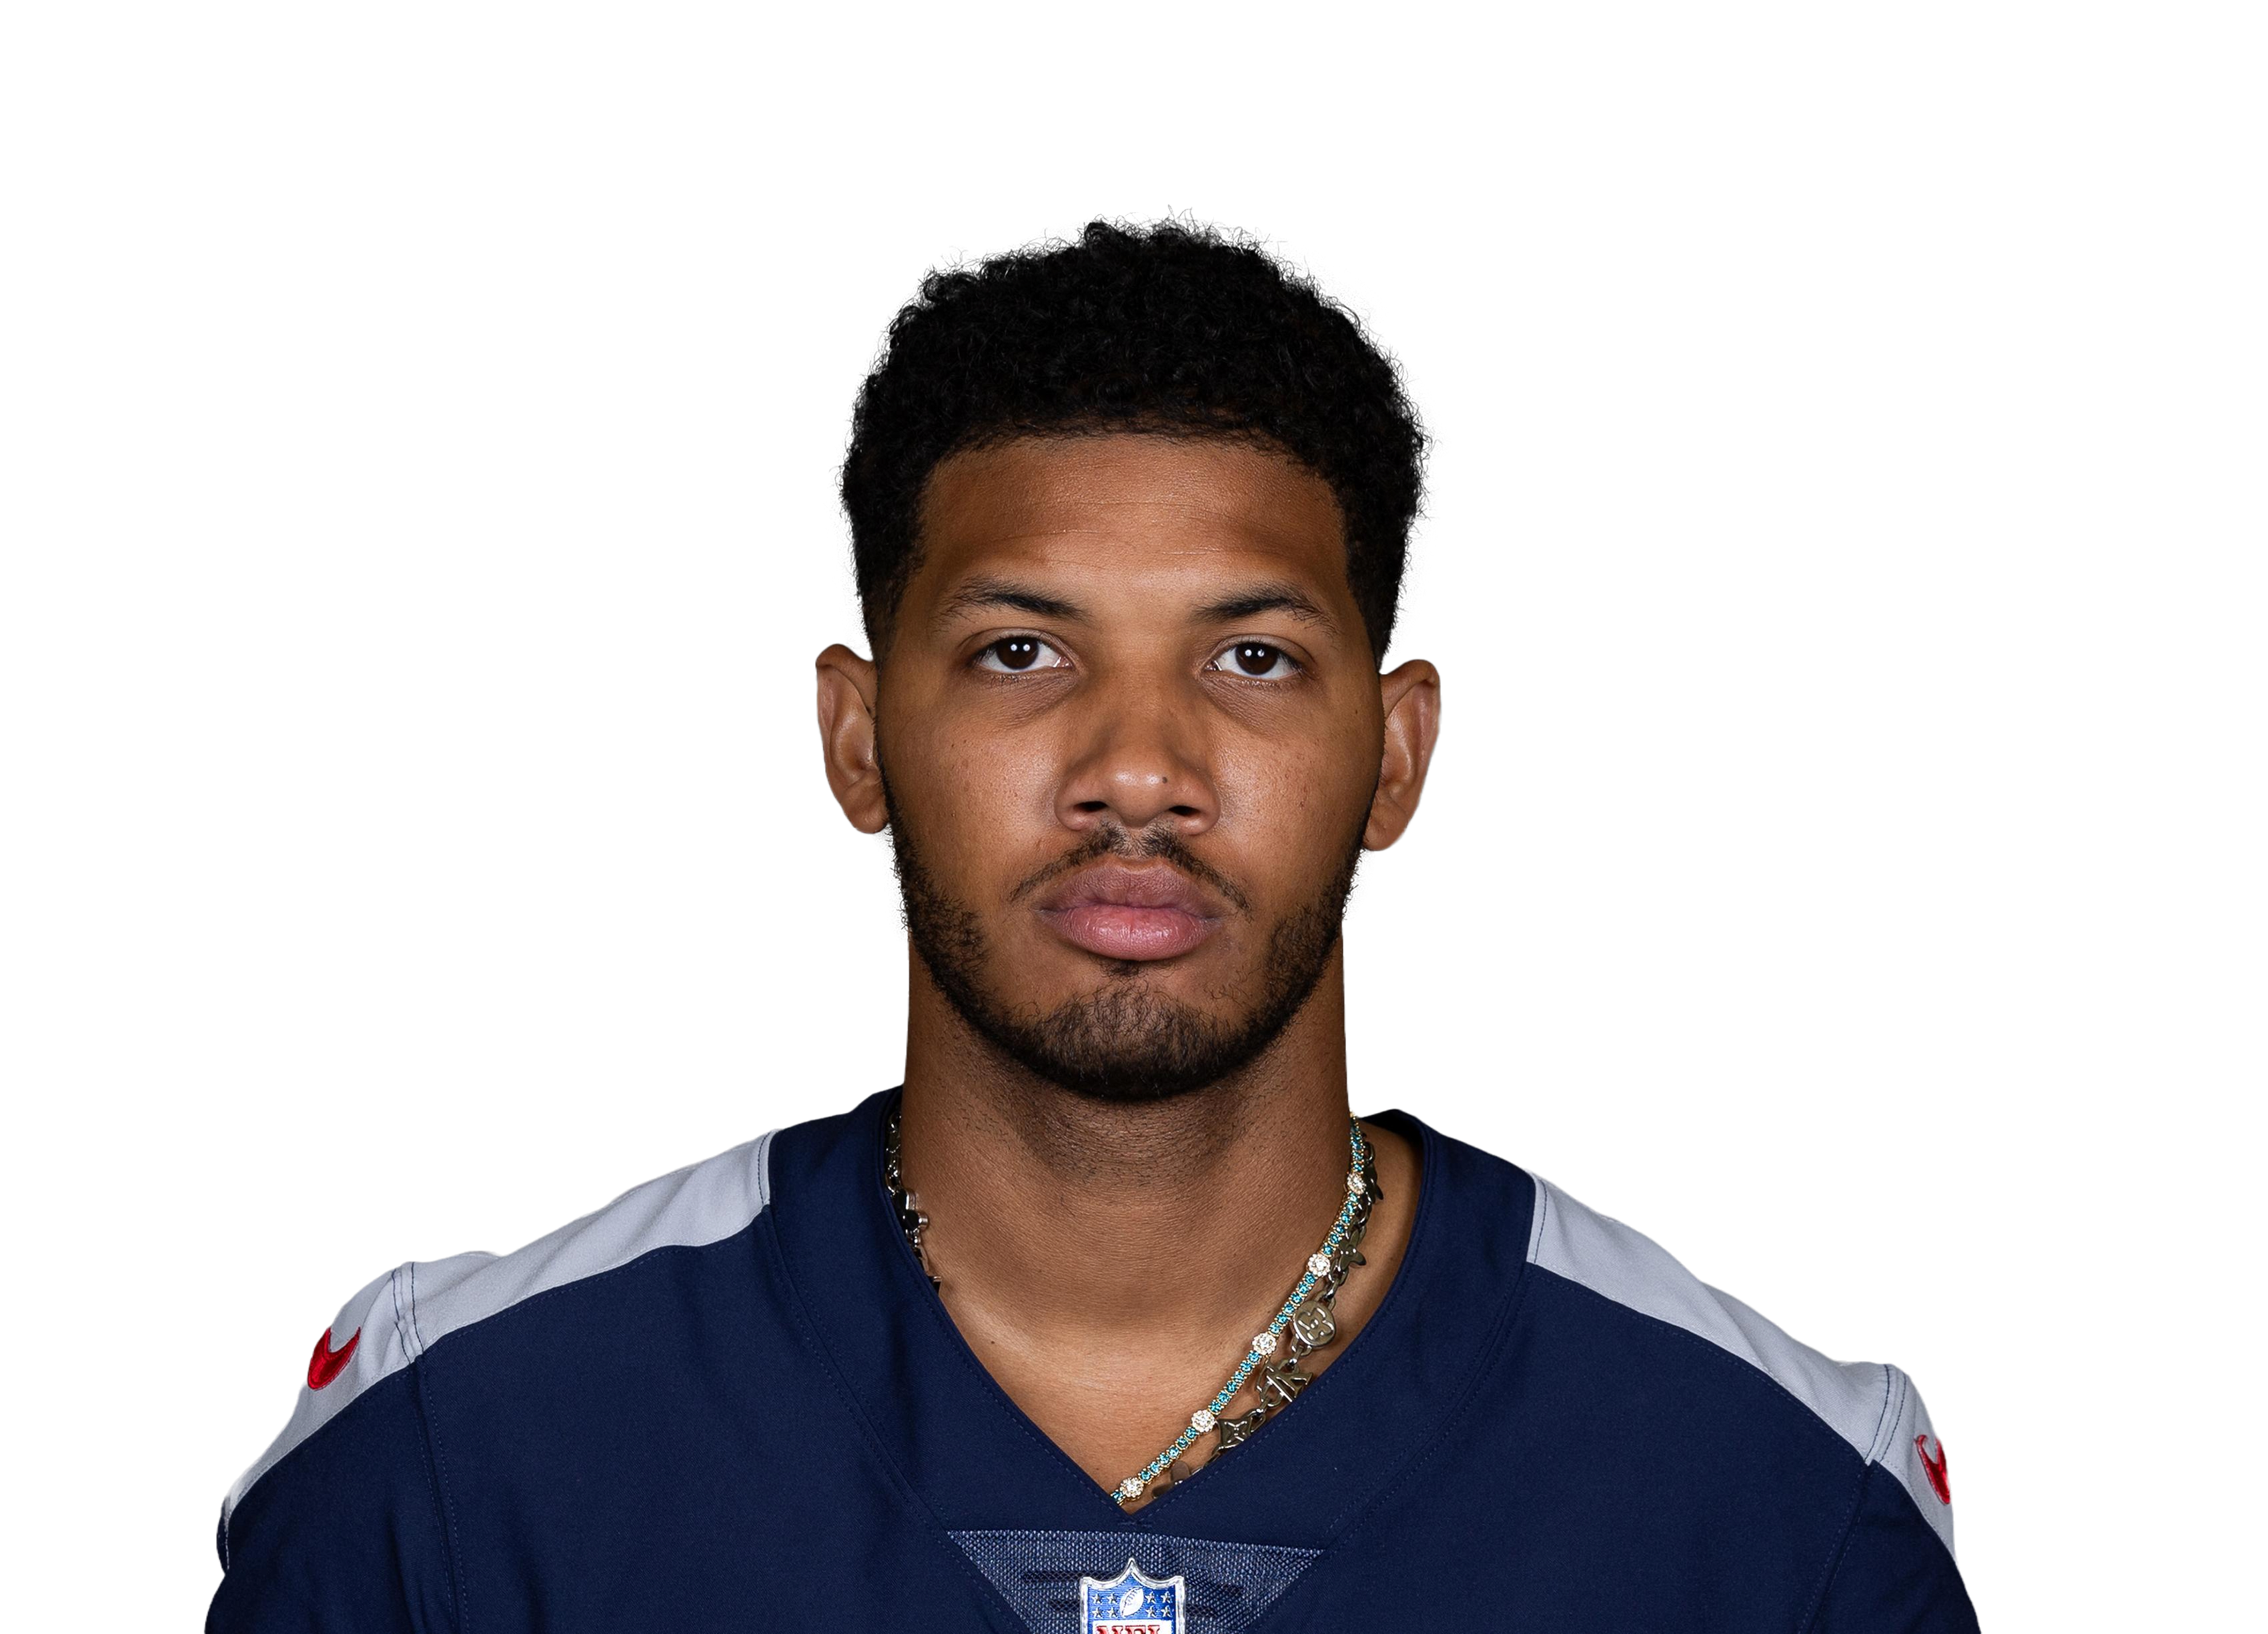 Tyler Boyd
|
CIN | 16 | 62 | 51.8 | 4.2 | 5.9 | 67 | 5 | 12.4 | 71.3% | 19.4% | 0.43 | |
| 35 |
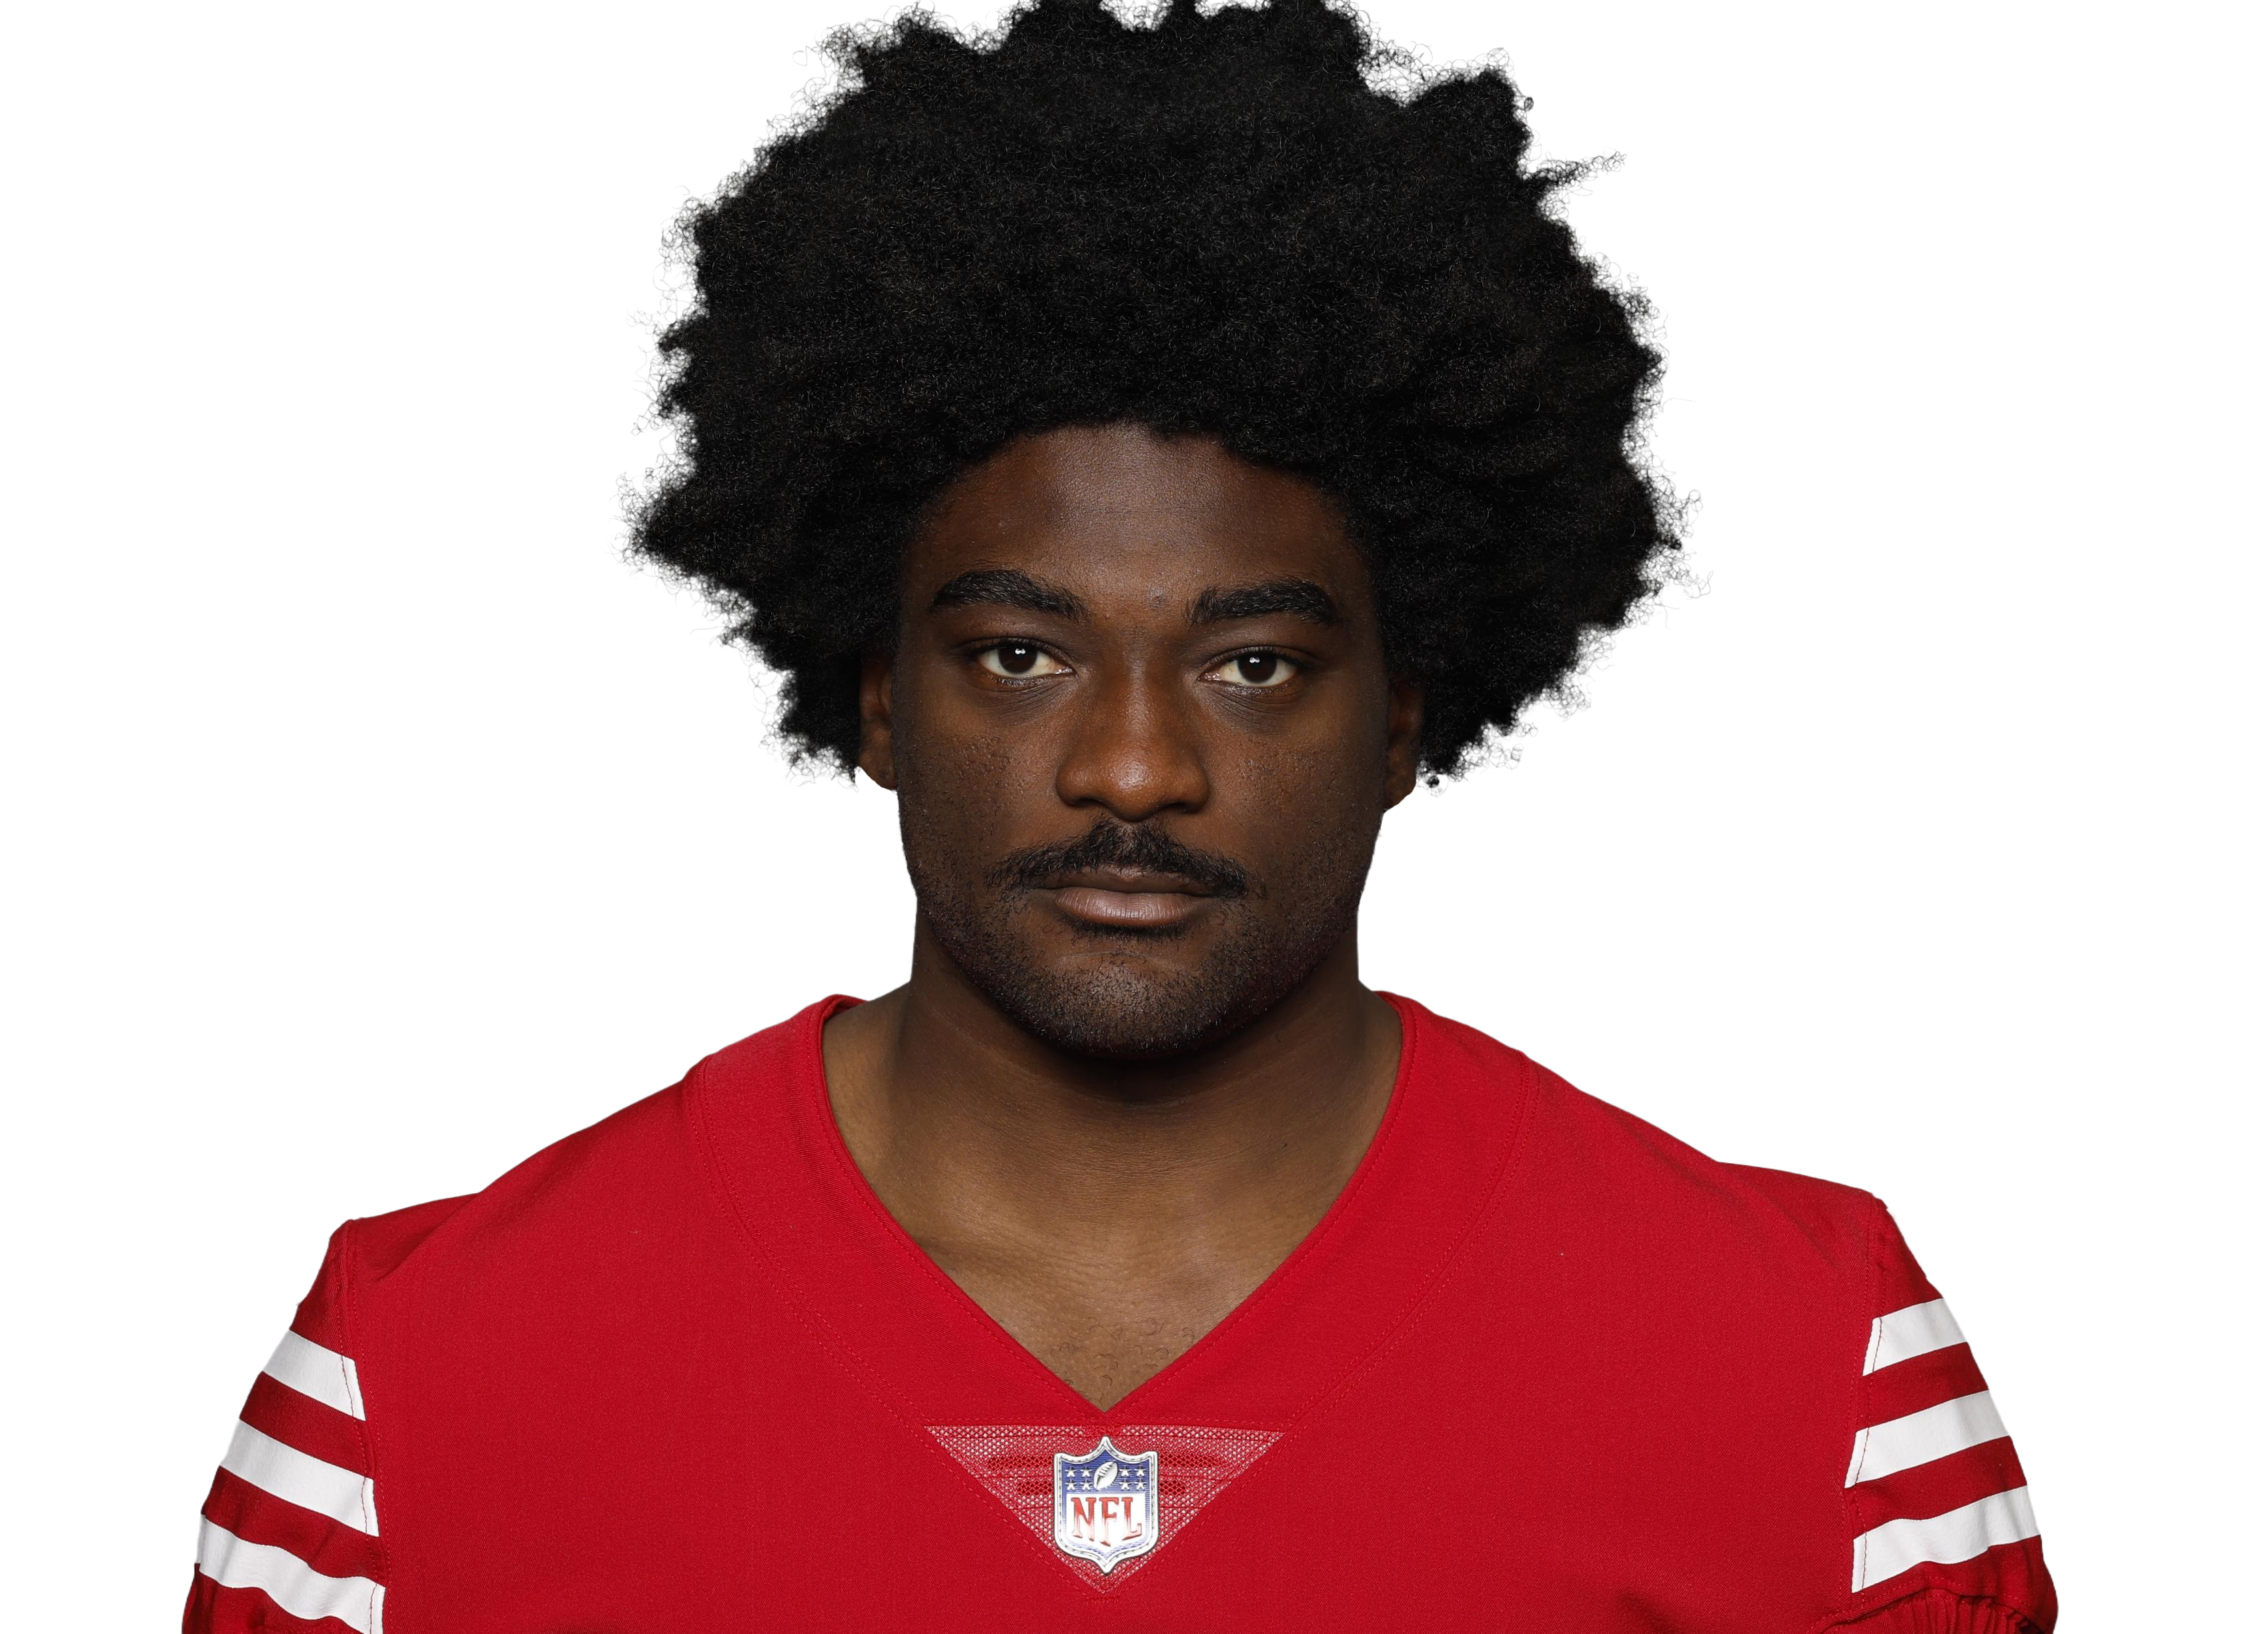 Brandon Aiyuk
|
SF | 17 | 60 | 48.6 | 3.3 | 4.9 | 56 | 5 | 14.8 | 66.7% | 17.1% | 0.40 | |
| 36 |
 Van Jefferson
|
LAR | 17 | 60 | 47.2 | 2.9 | 5.2 | 50 | 6 | 16.0 | 56.2% | 14.4% | 0.38 | |
| 37 |
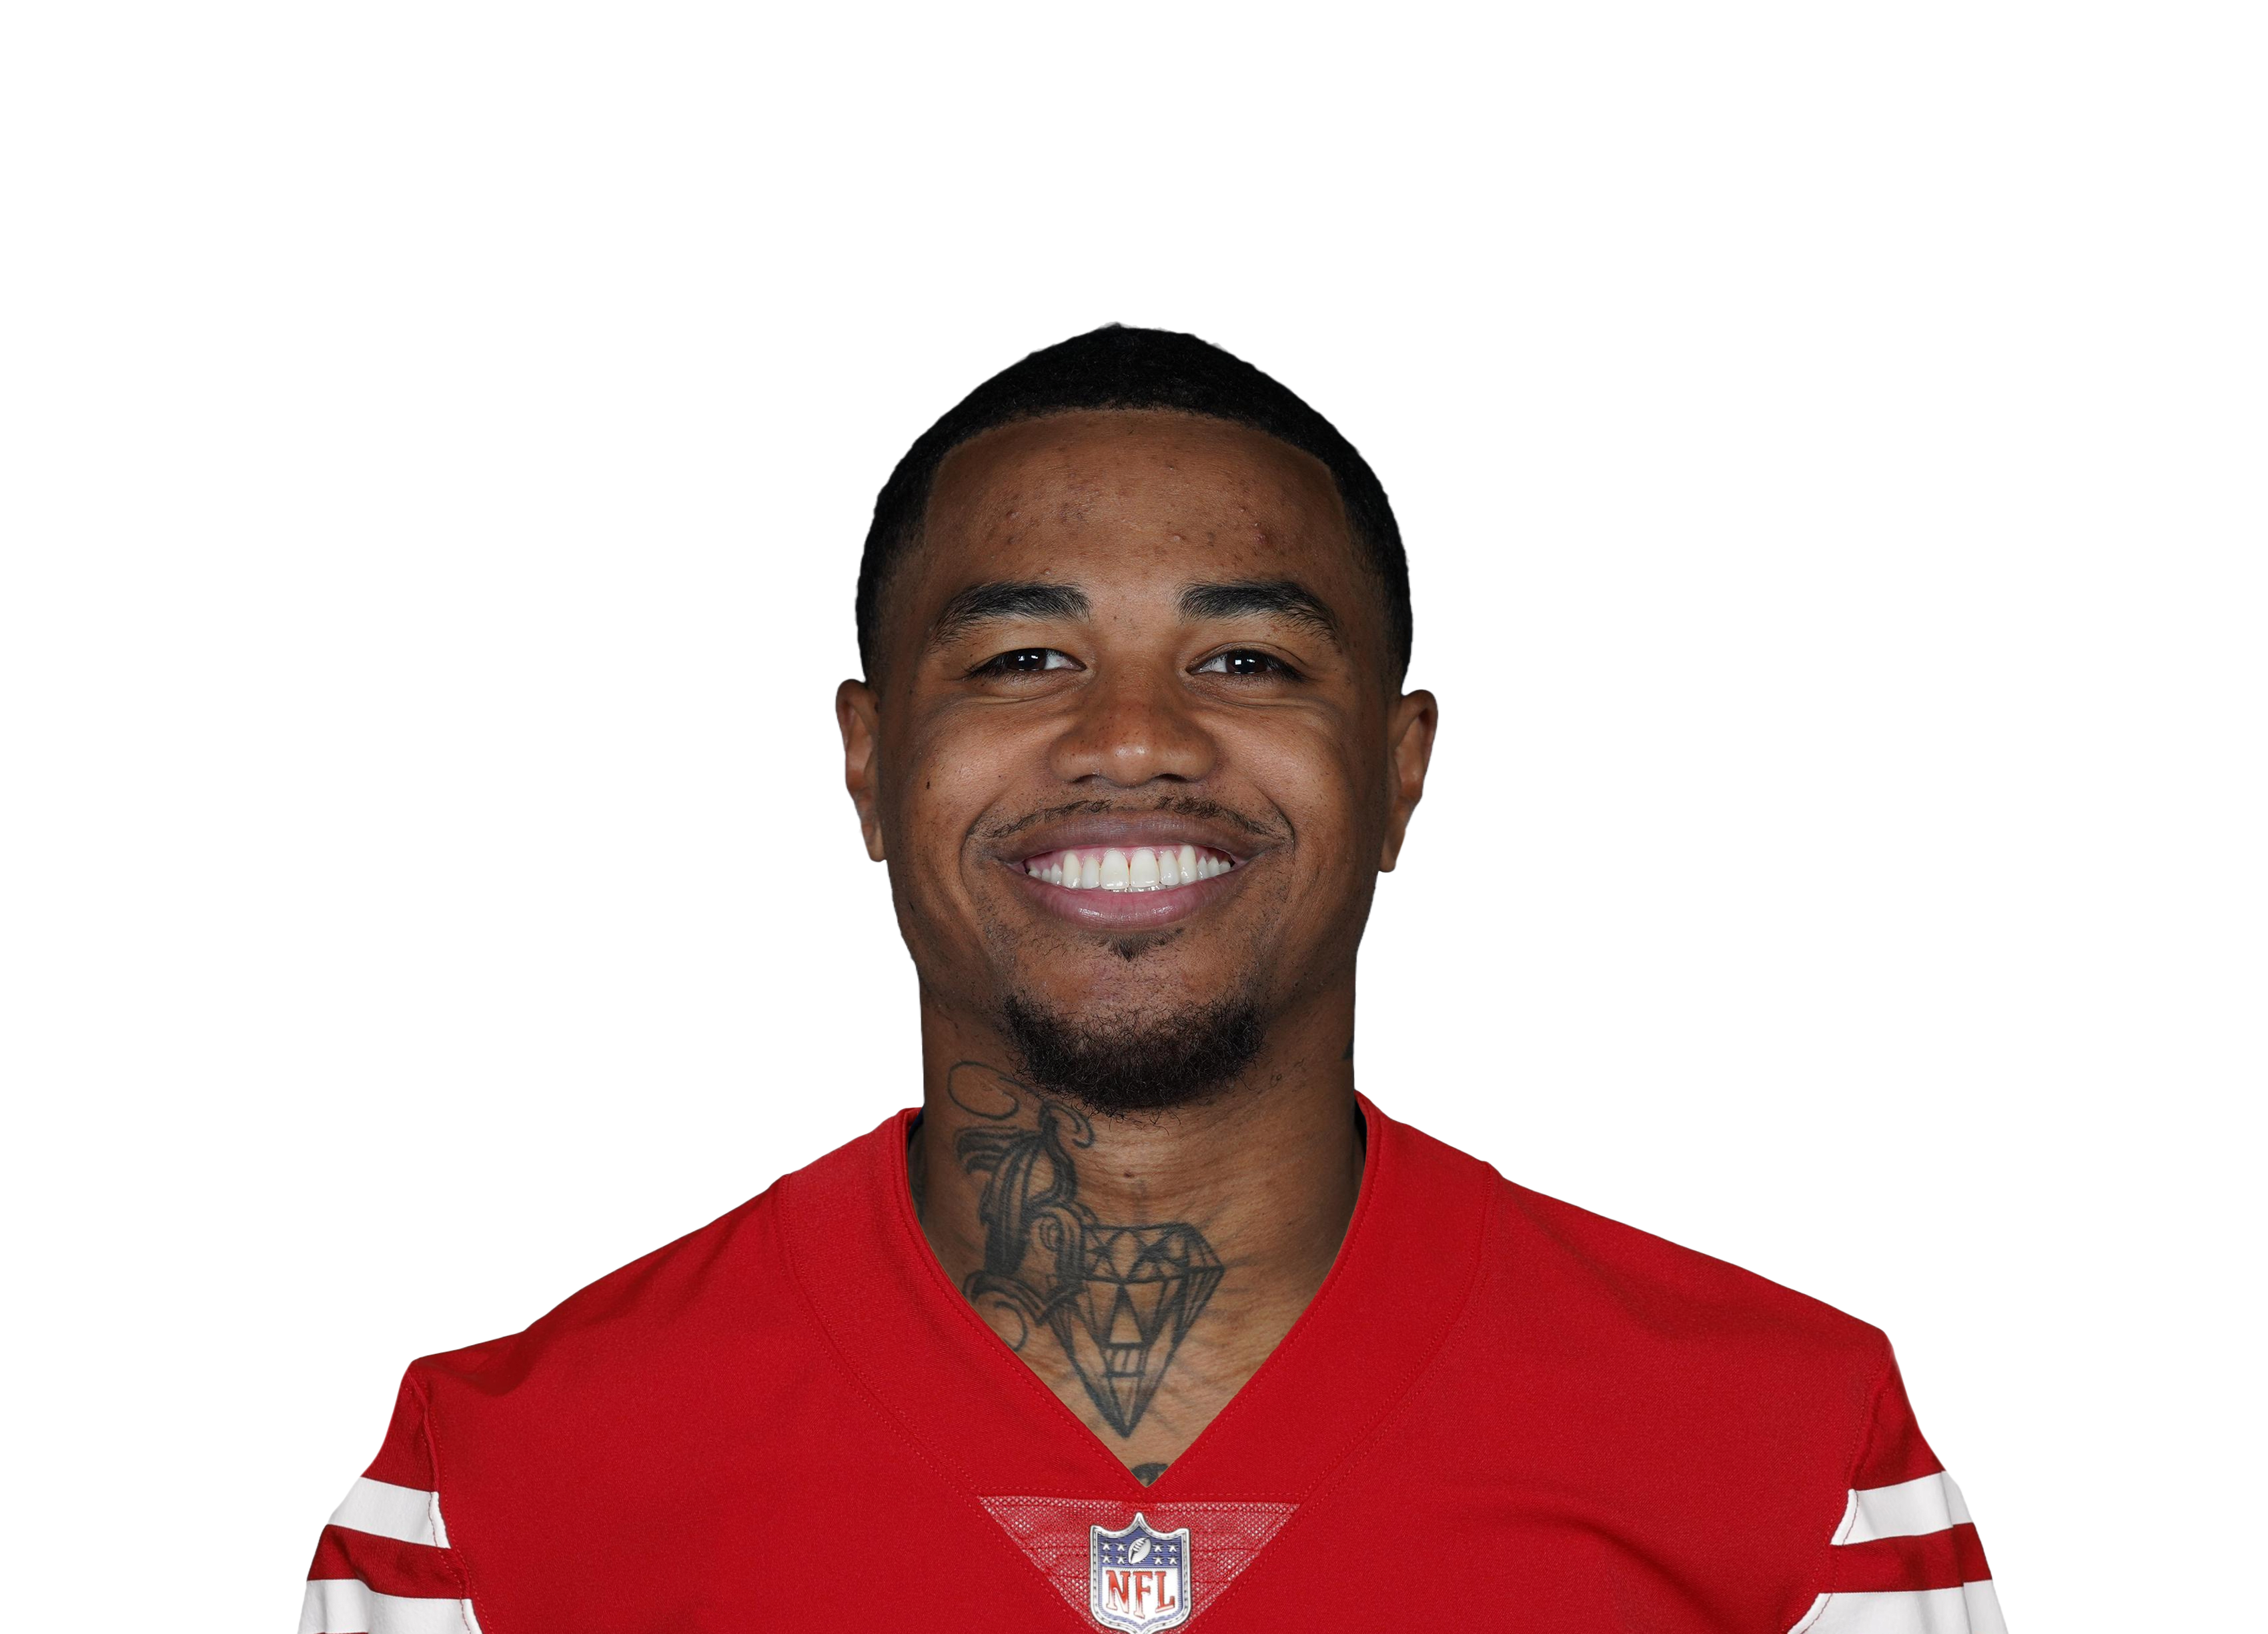 Kendrick Bourne
|
NE | 17 | 61 | 47.1 | 3.2 | 4.1 | 55 | 5 | 14.5 | 78.6% | 13.0% | 0.28 | |
| 38 |
 Courtland Sutton
|
DEN | 17 | 57 | 45.6 | 3.4 | 5.8 | 58 | 2 | 13.4 | 59.2% | 18.2% | 0.48 | |
| 39 |
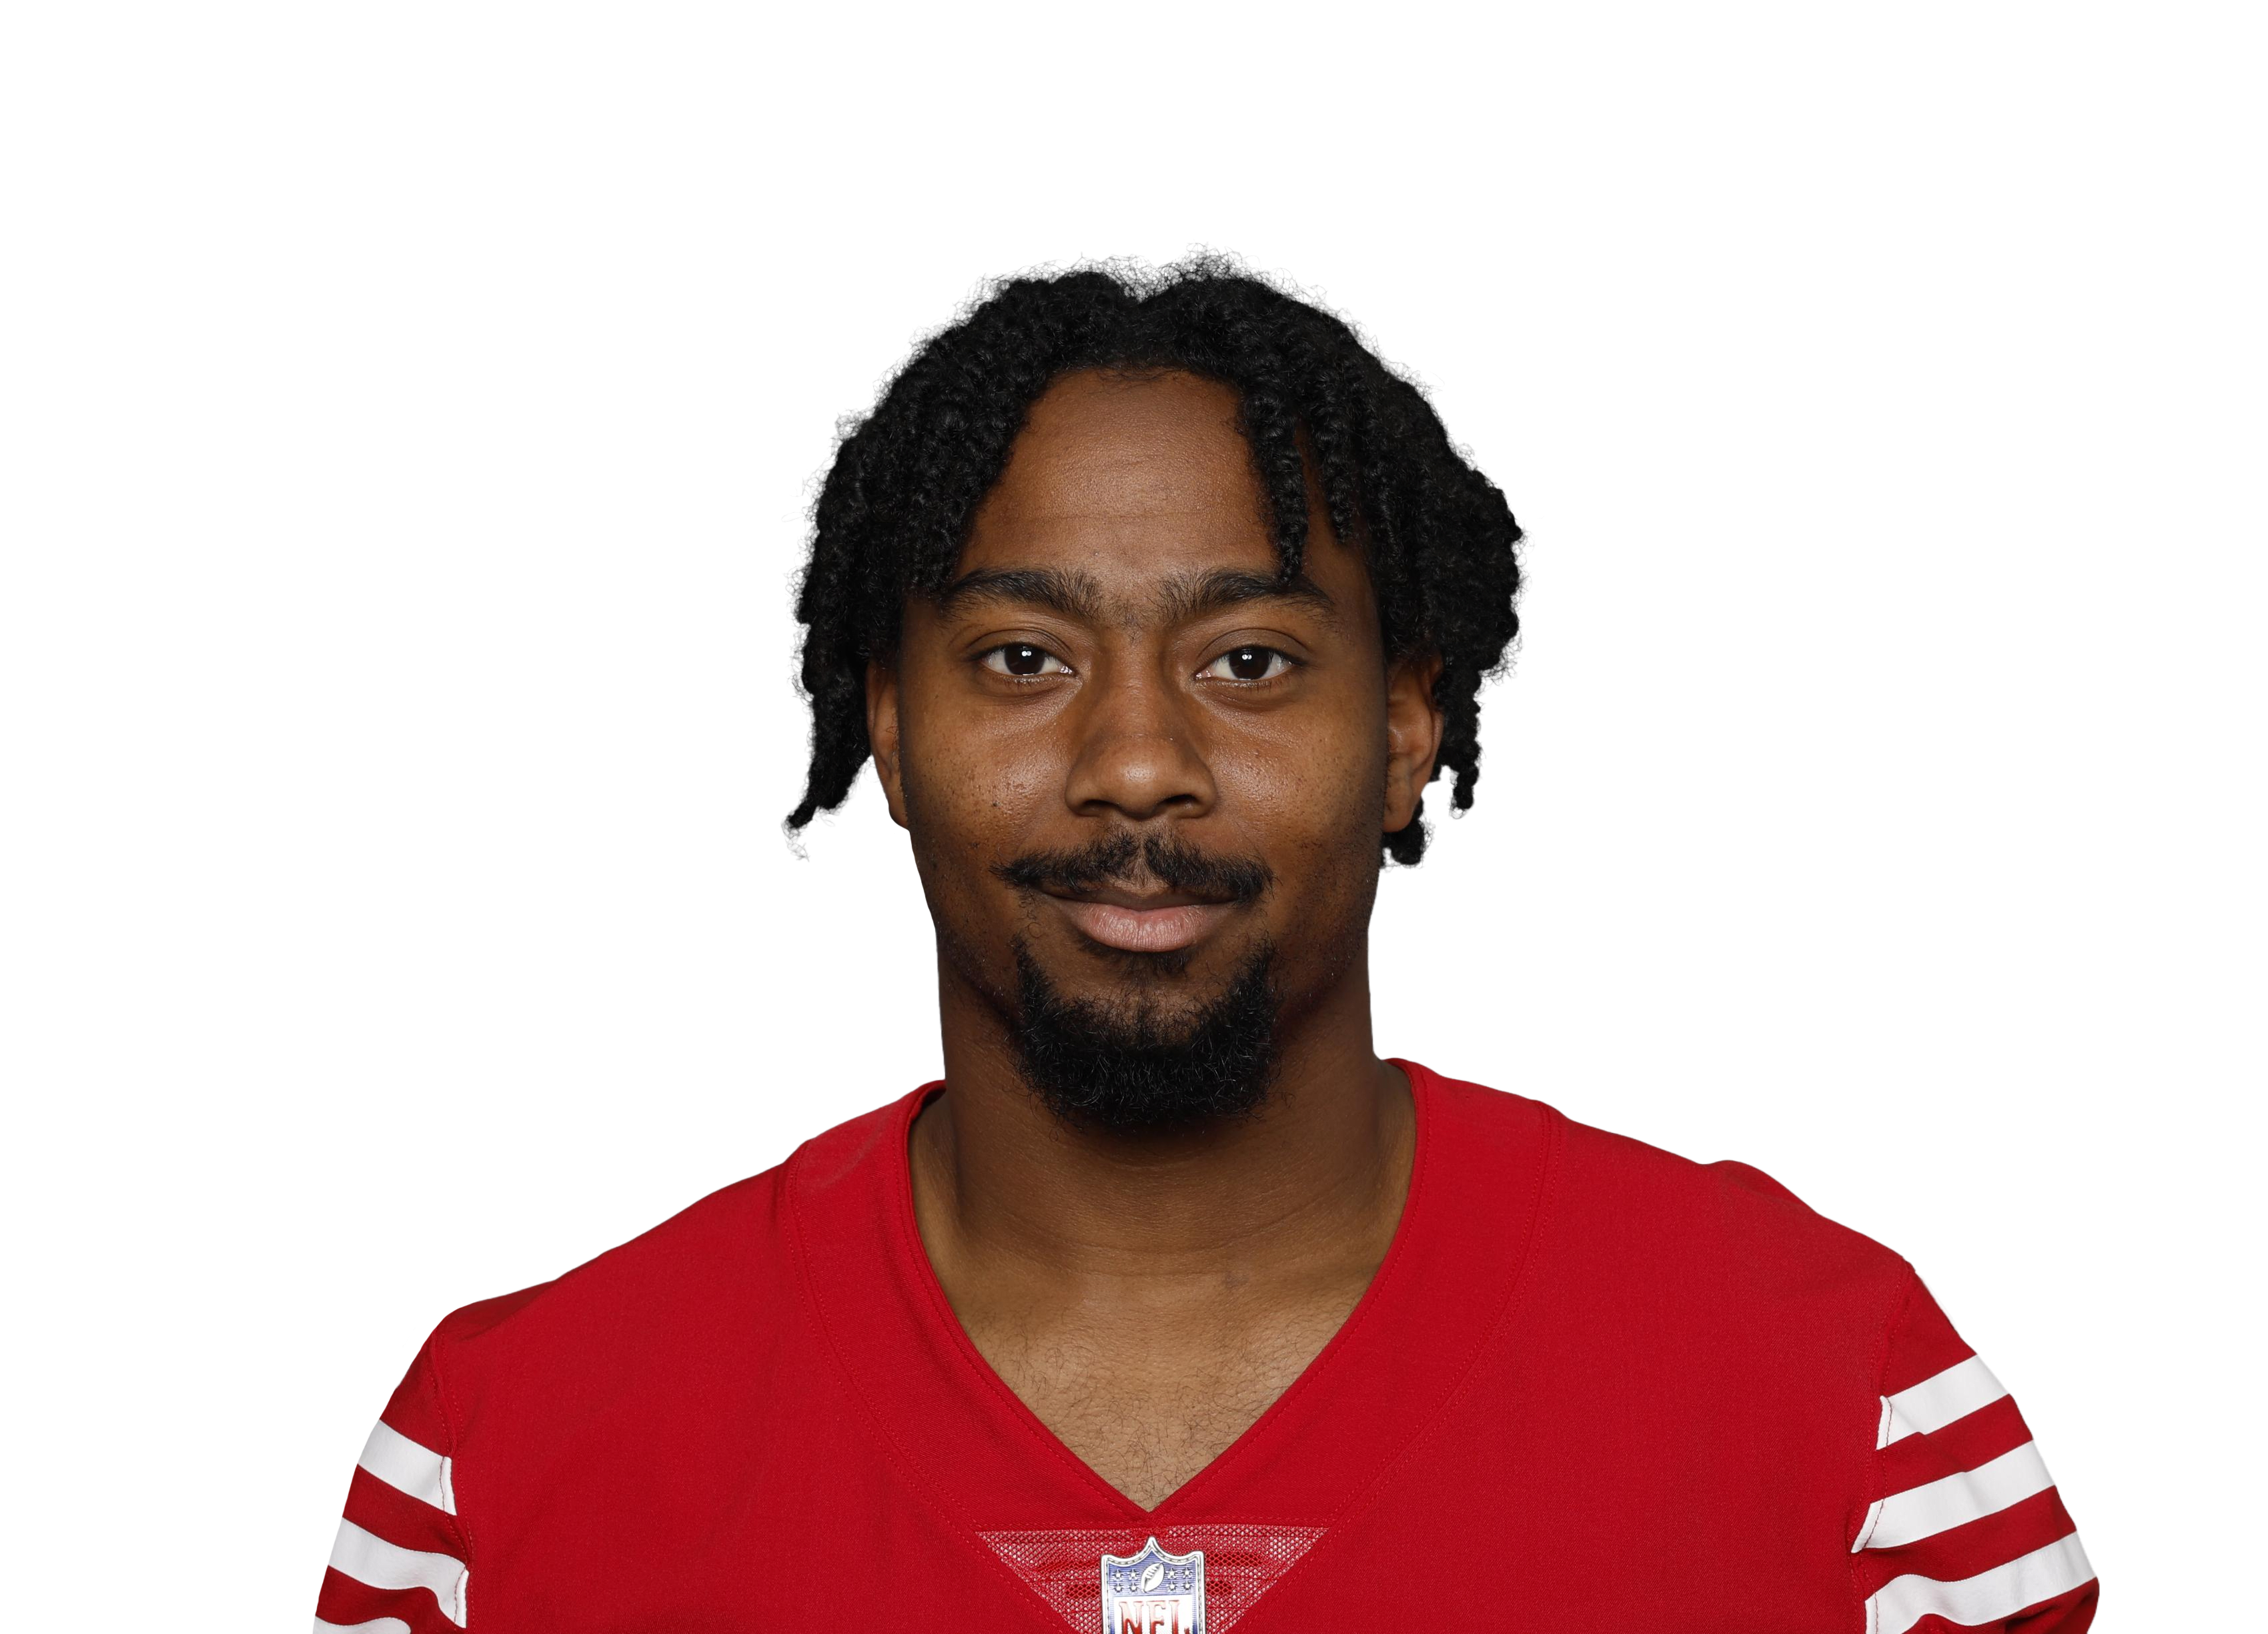 Russell Gage
|
ATL | 13 | 65 | 59.2 | 5.1 | 7.2 | 66 | 4 | 11.7 | 70.2% | 23.6% | 0.55 | |
| 40 |
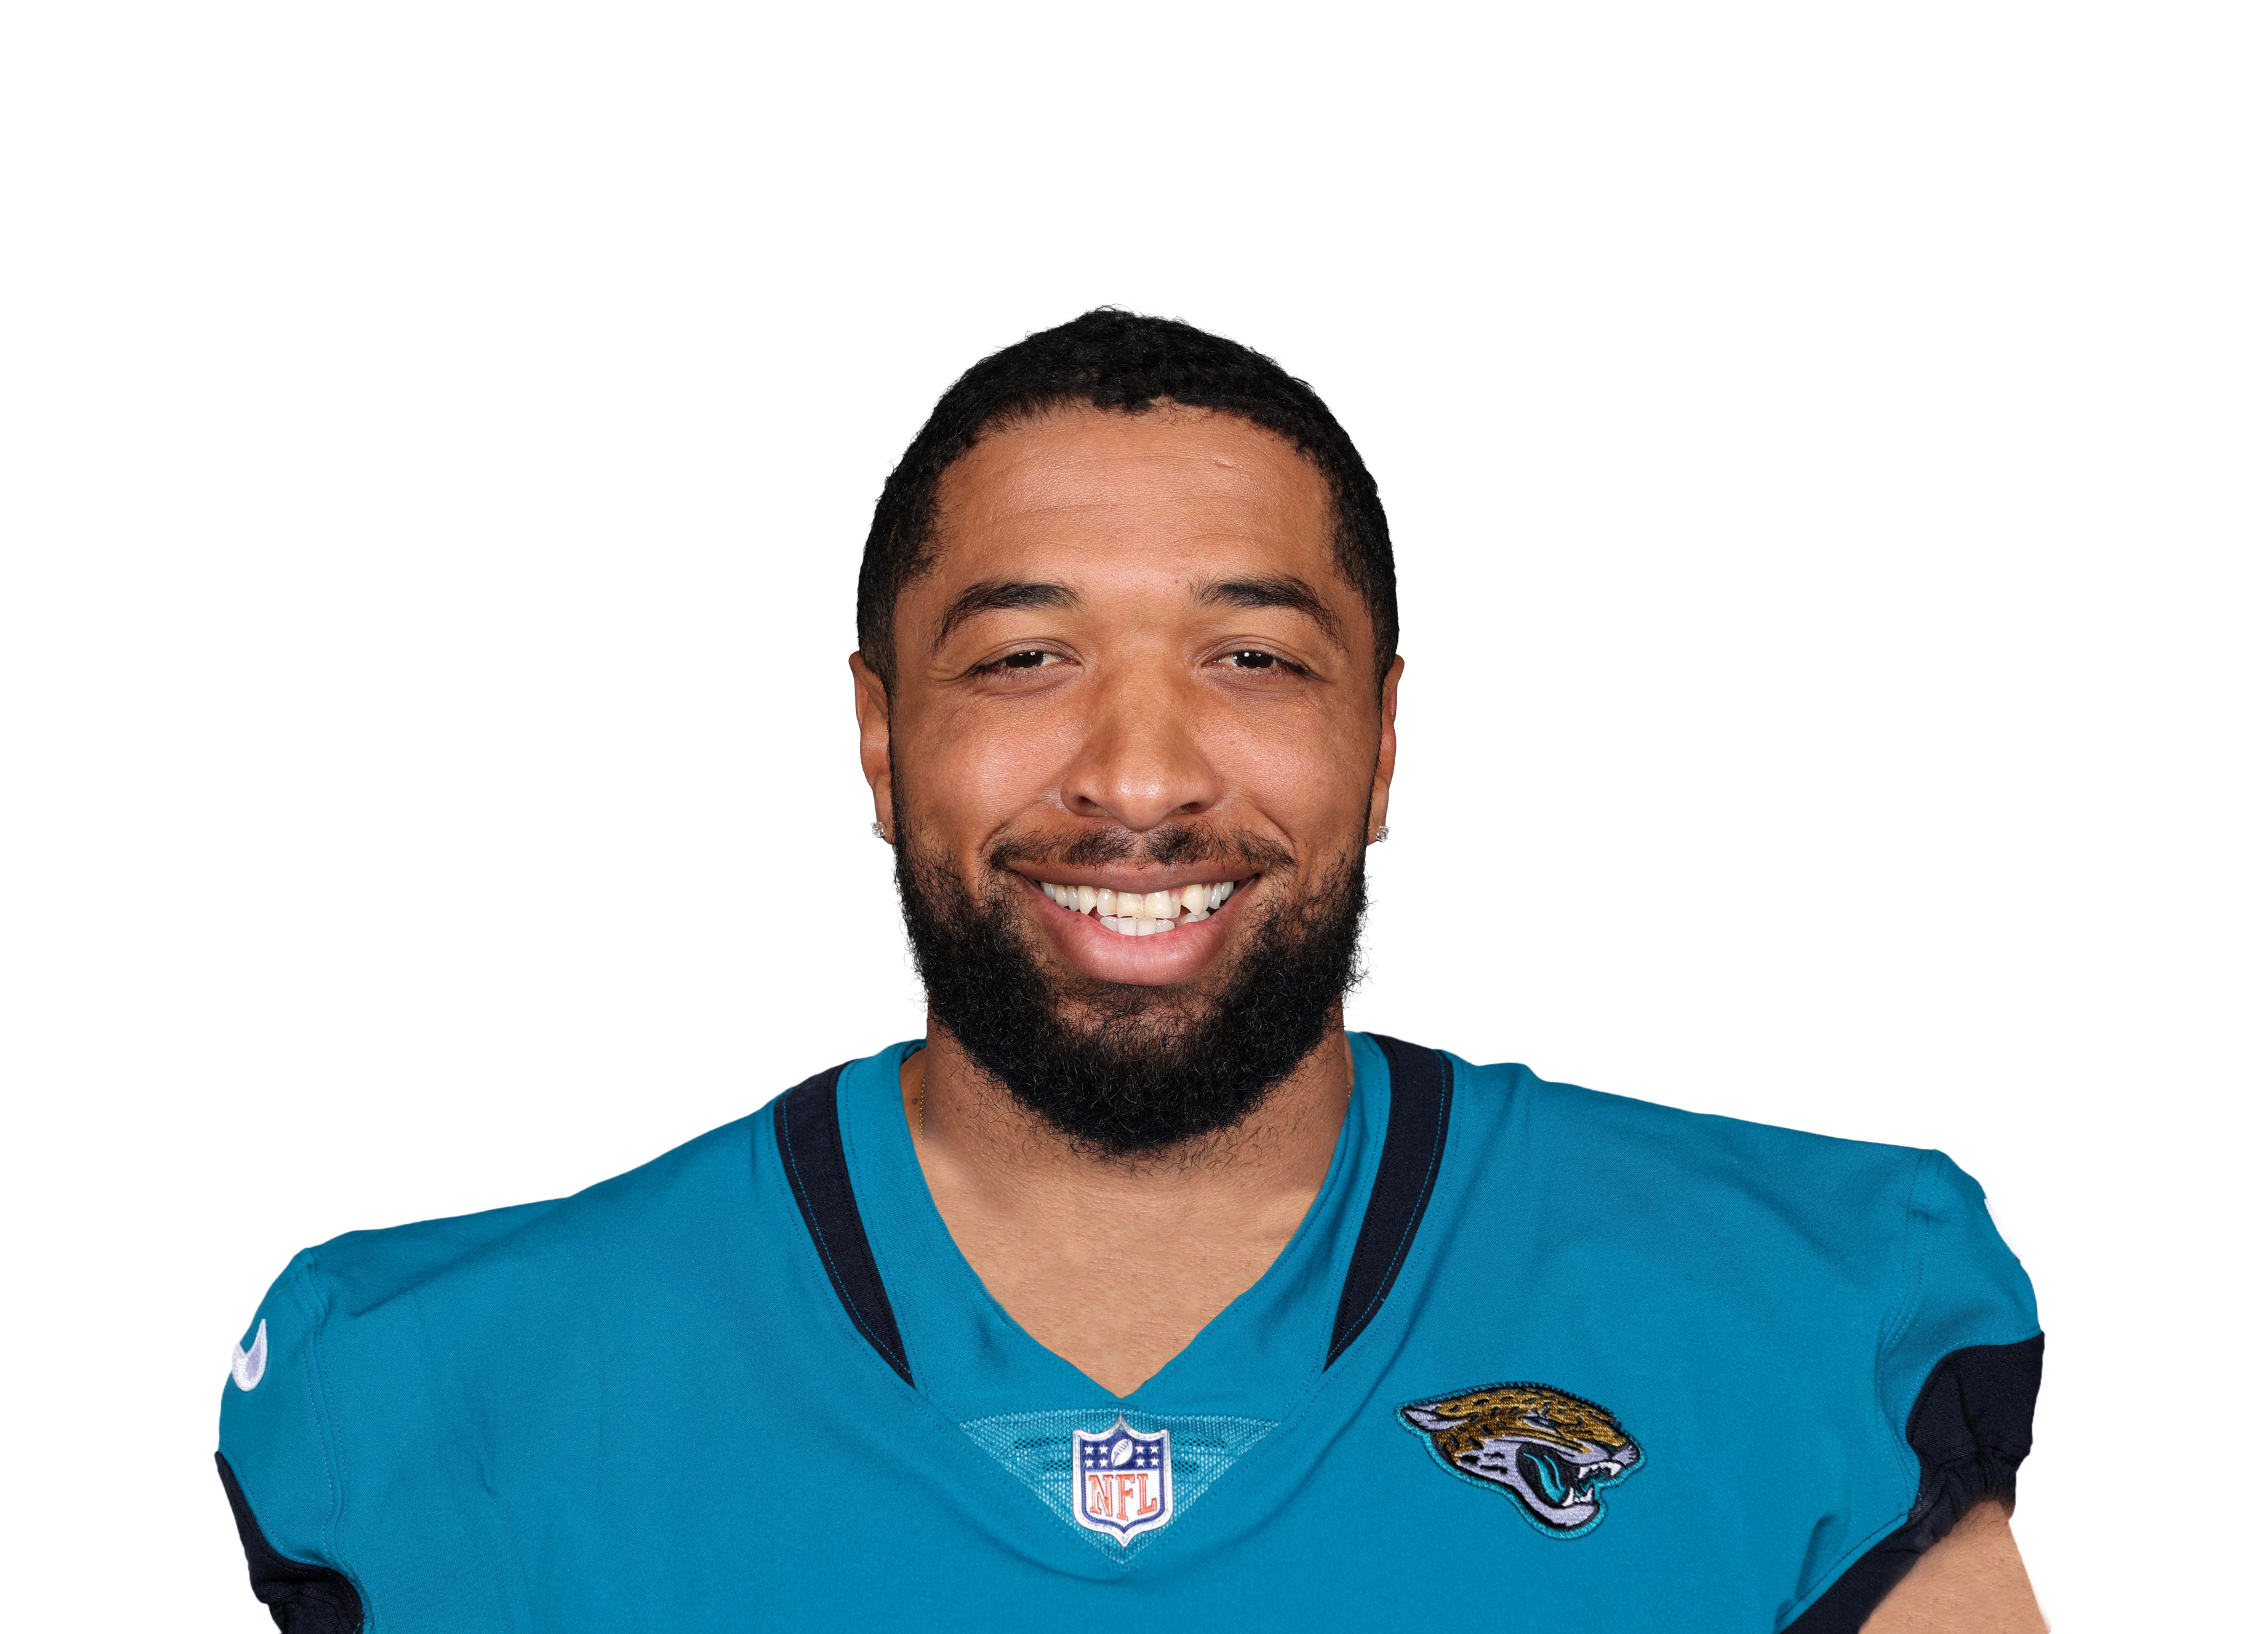 Tim Patrick
|
DEN | 16 | 58 | 45.9 | 3.3 | 5.3 | 53 | 5 | 13.8 | 62.4% | 17.9% | 0.44 | |
| 41 |
 Adam Thielen
|
MIN | 13 | 71 | 55.8 | 5.2 | 7.3 | 67 | 10 | 10.8 | 70.5% | 20.4% | 0.48 | |
| 42 |
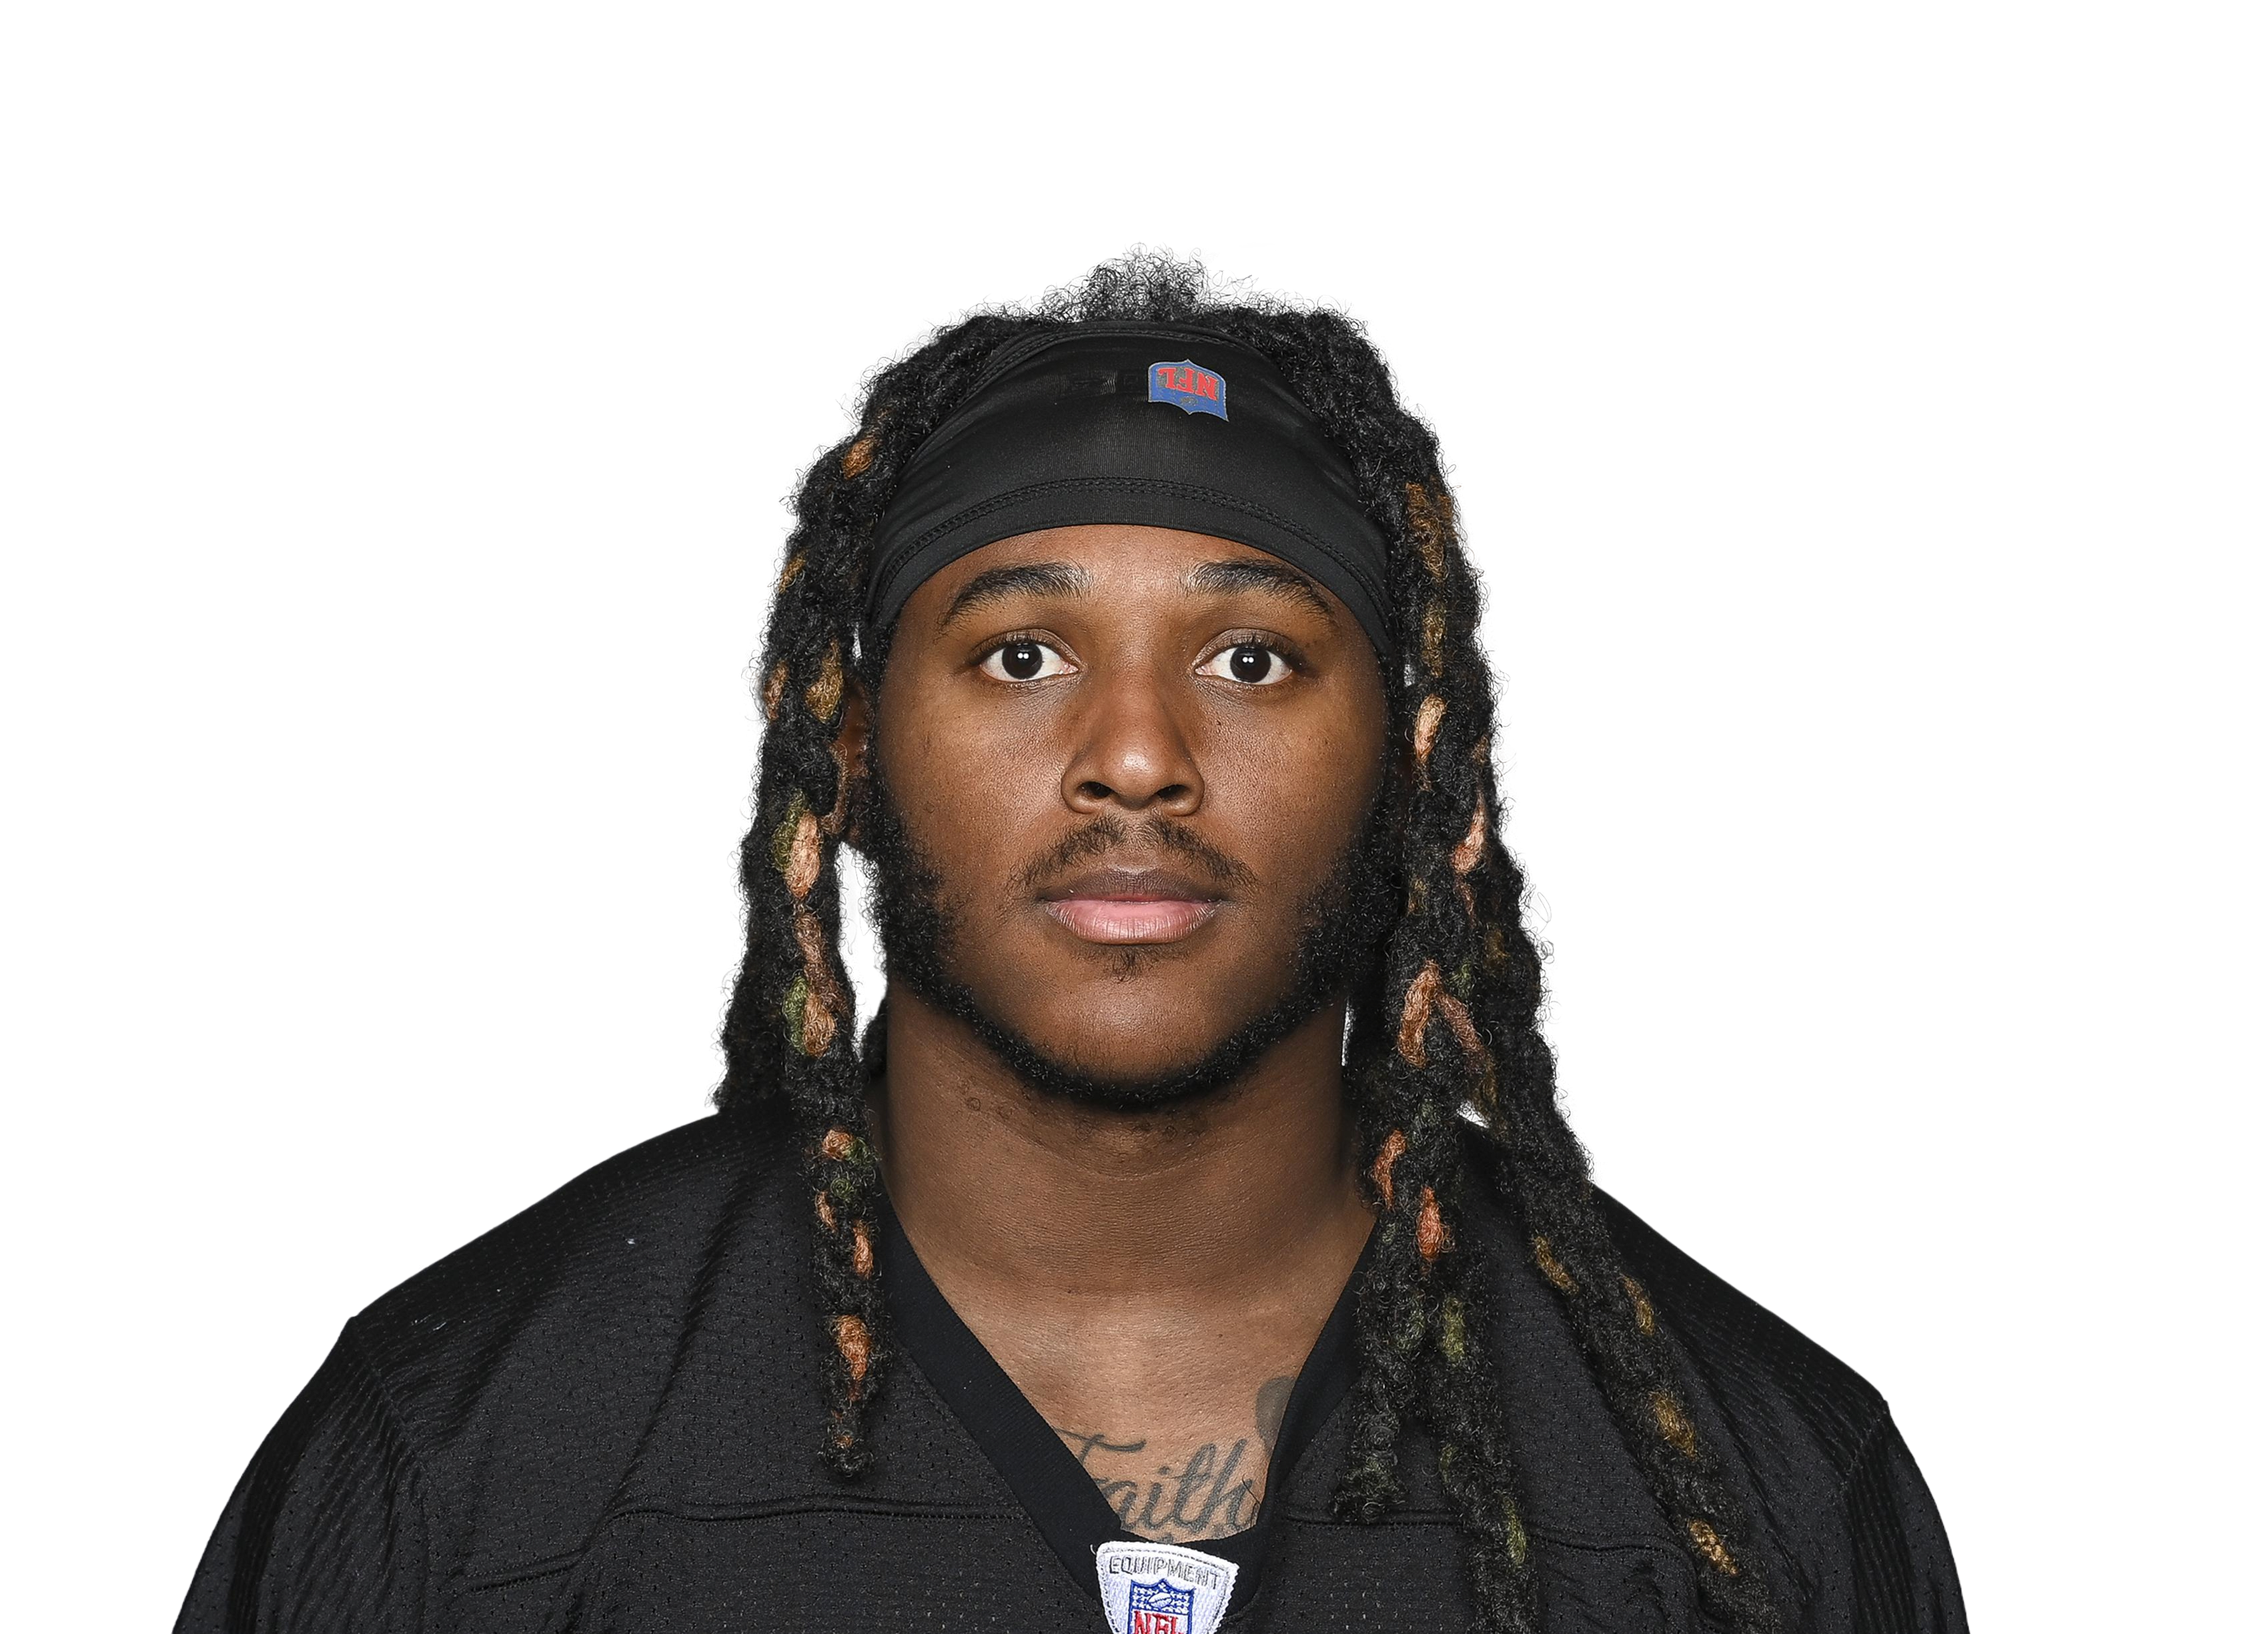 Marquez Callaway
|
NO | 17 | 58 | 41.1 | 2.7 | 4.9 | 46 | 6 | 15.2 | 54.8% | 18.7% | 0.49 | |
| 43 |
 Cole Beasley
|
BUF | 16 | 59 | 43.3 | 5.1 | 7.0 | 82 | 1 | 8.5 | 73.2% | 18.4% | 0.37 | |
| 44 |
 Mecole Hardman
|
KC | 17 | 57 | 40.8 | 3.5 | 4.9 | 59 | 2 | 11.7 | 71.1% | 12.8% | 0.28 | |
| 45 |
 K.J. Osborn
|
MIN | 17 | 59 | 38.5 | 2.9 | 4.8 | 50 | 7 | 13.1 | 61.0% | 14.1% | 0.33 | |
| 46 |
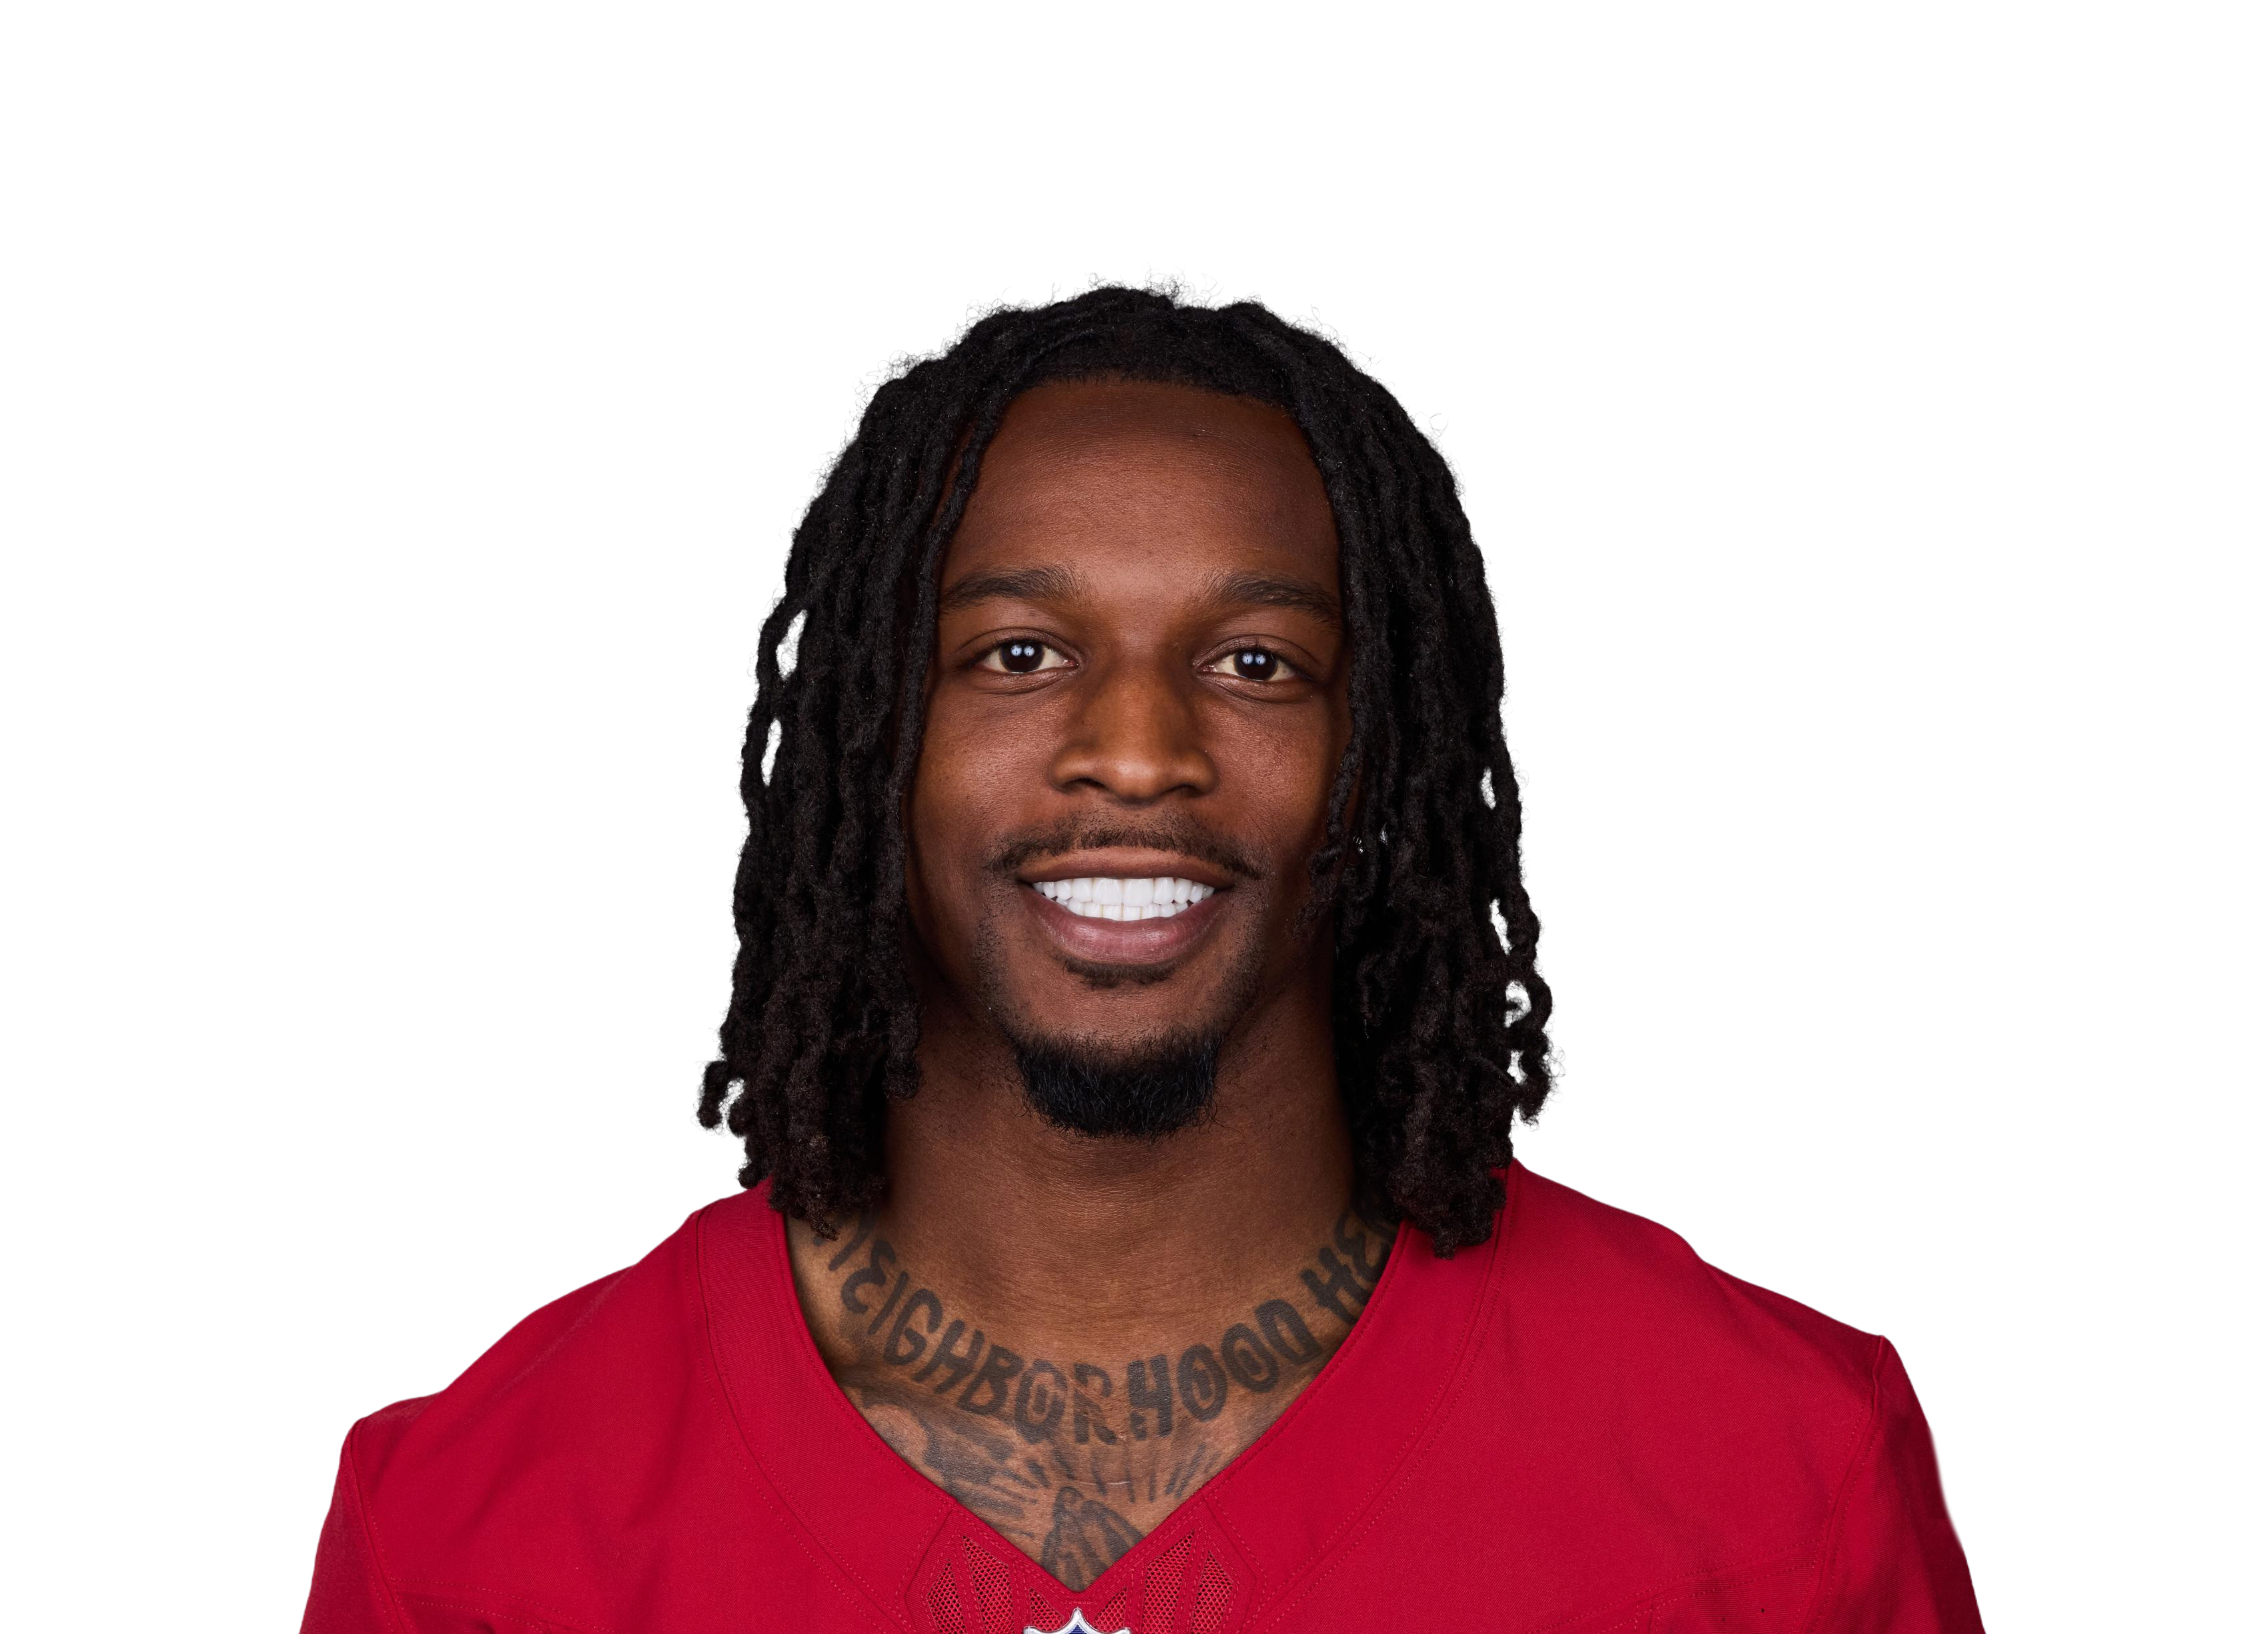 Quez Watkins
|
PHI | 17 | 51 | 38.1 | 2.5 | 3.6 | 43 | 1 | 15.0 | 69.4% | 13.5% | 0.32 | |
| 47 |
 Emmanuel Sanders
|
BUF | 14 | 57 | 44.7 | 3.0 | 5.1 | 42 | 4 | 14.9 | 58.3% | 14.3% | 0.38 | |
| 48 |
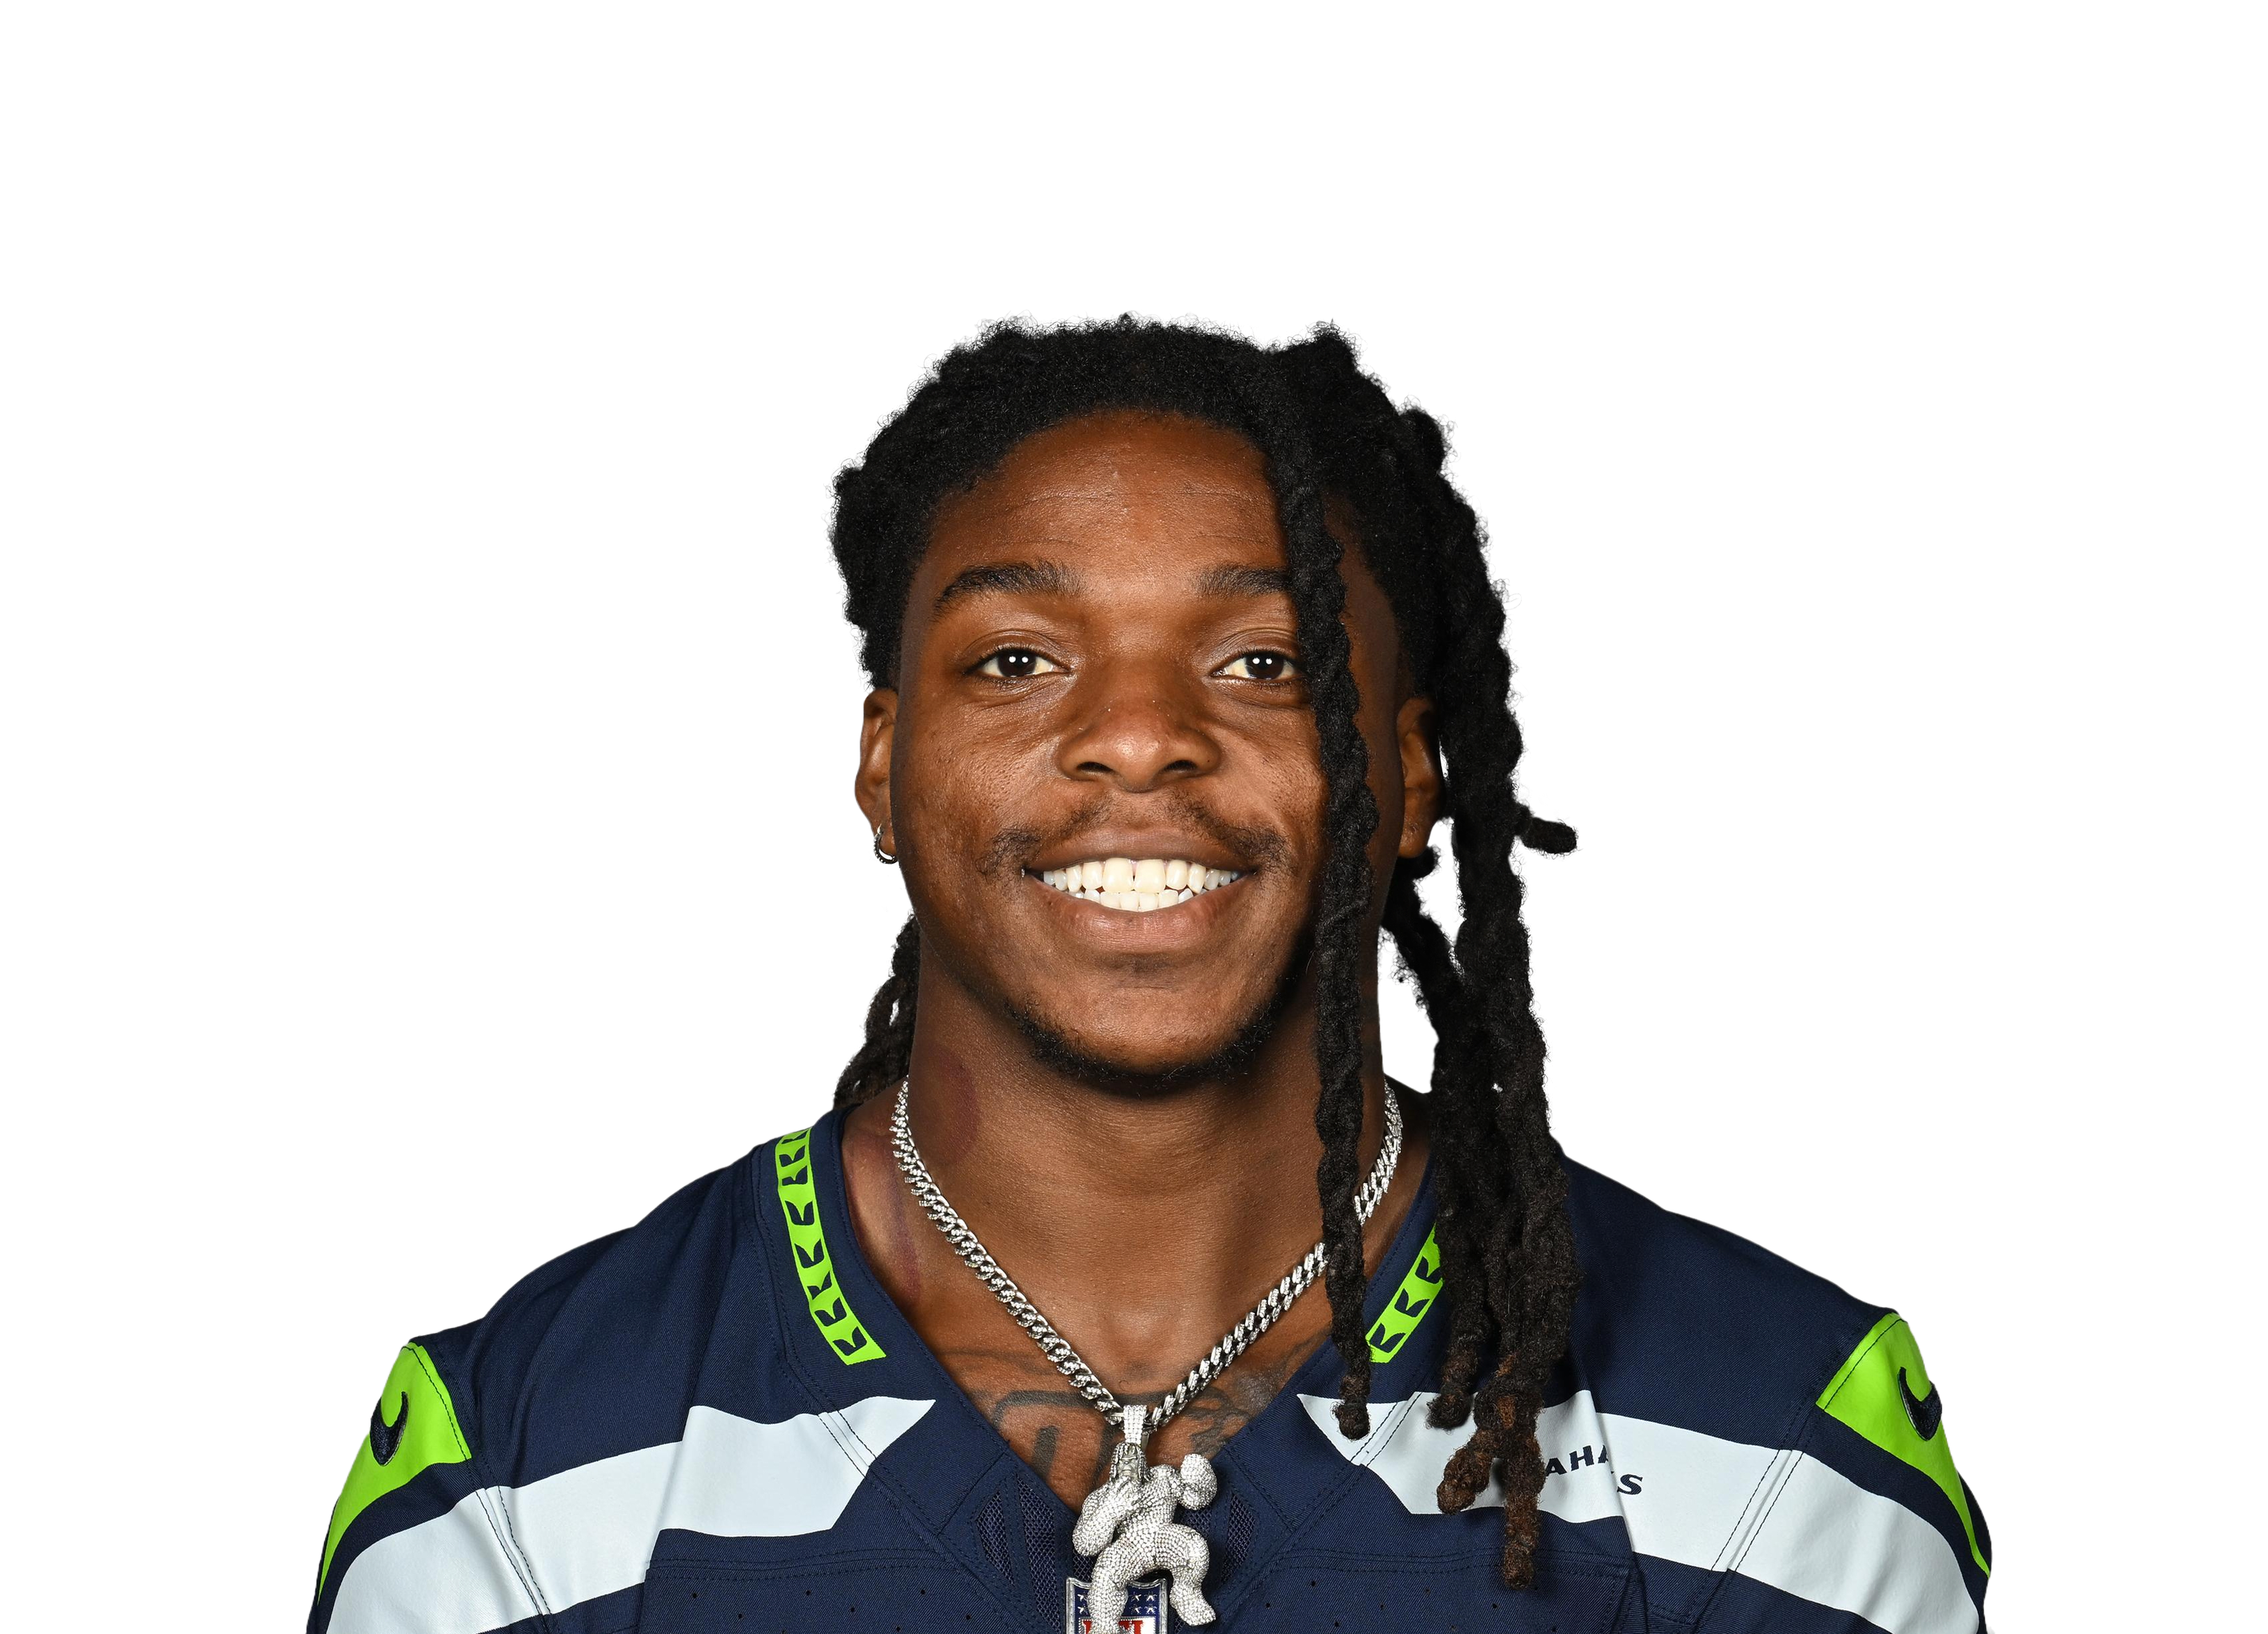 Laviska Shenault Jr.
|
JAX | 16 | 54 | 38.7 | 3.9 | 6.2 | 63 | 0 | 9.8 | 63.0% | 18.6% | 0.37 | |
| 49 |
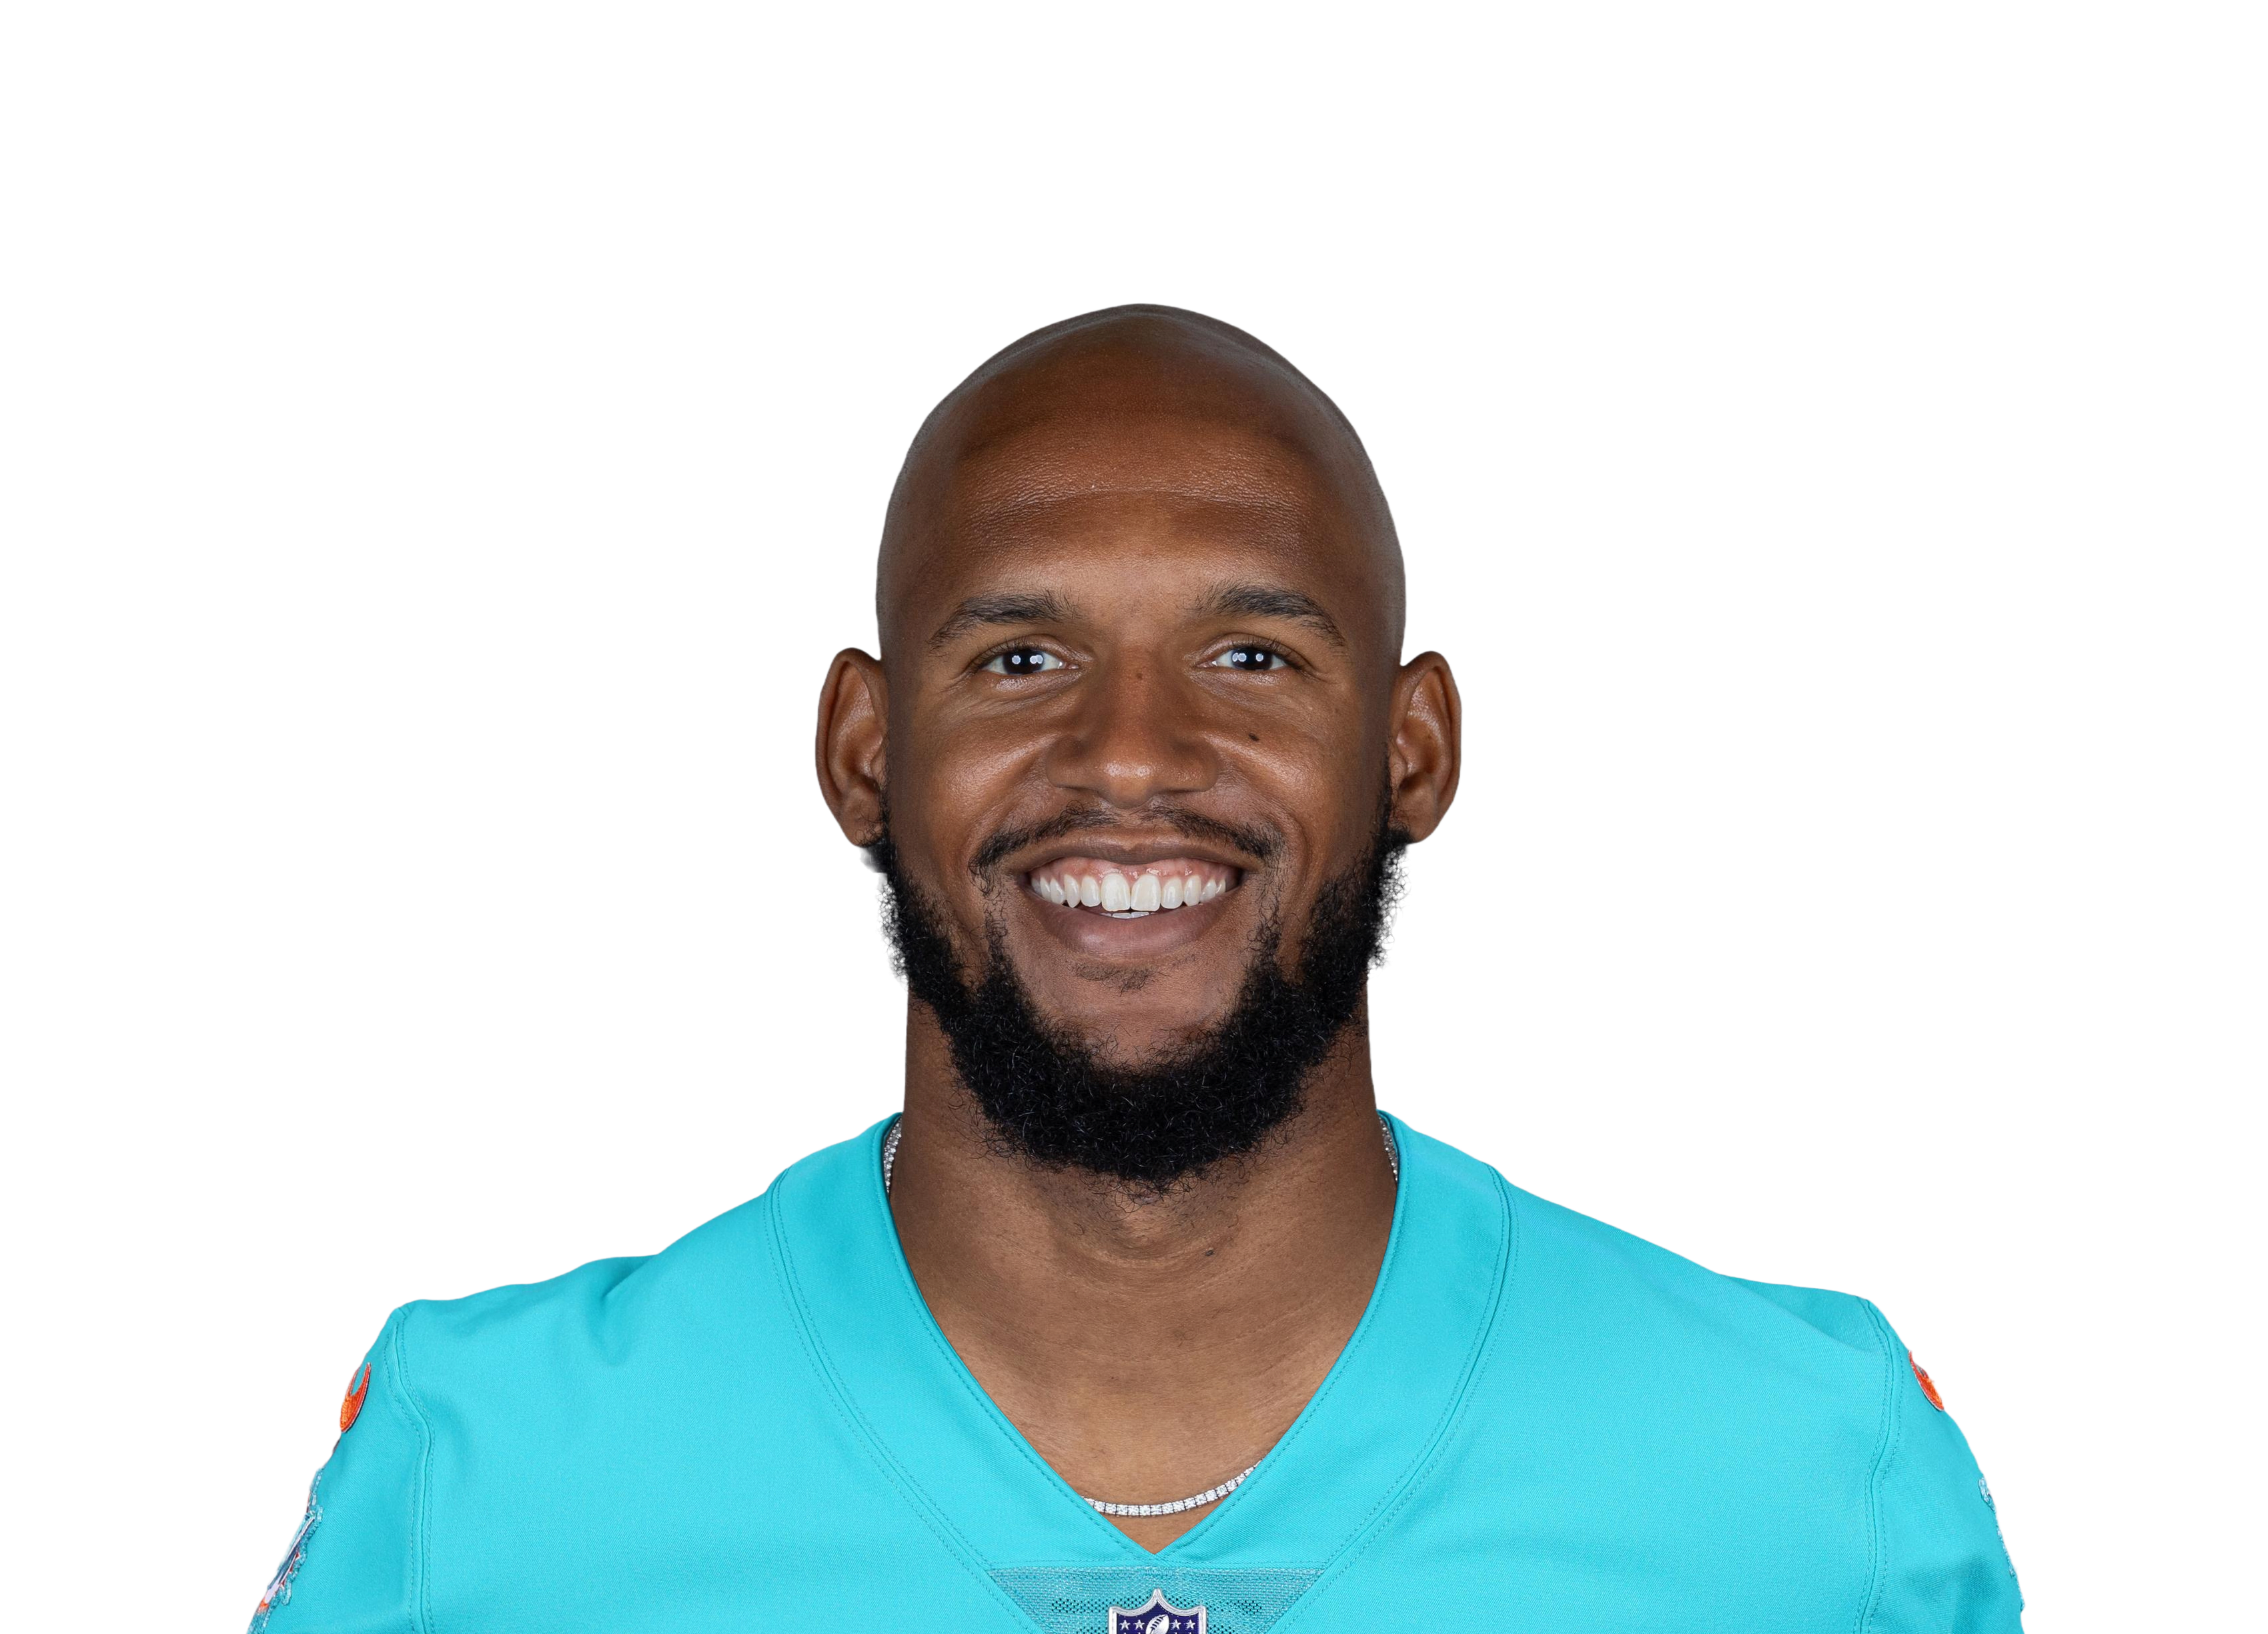 Cedrick Wilson Jr.
|
DAL | 14 | 61 | 43.0 | 3.2 | 4.4 | 45 | 6 | 13.4 | 73.8% | 11.6% | 0.27 | |
| 50 |
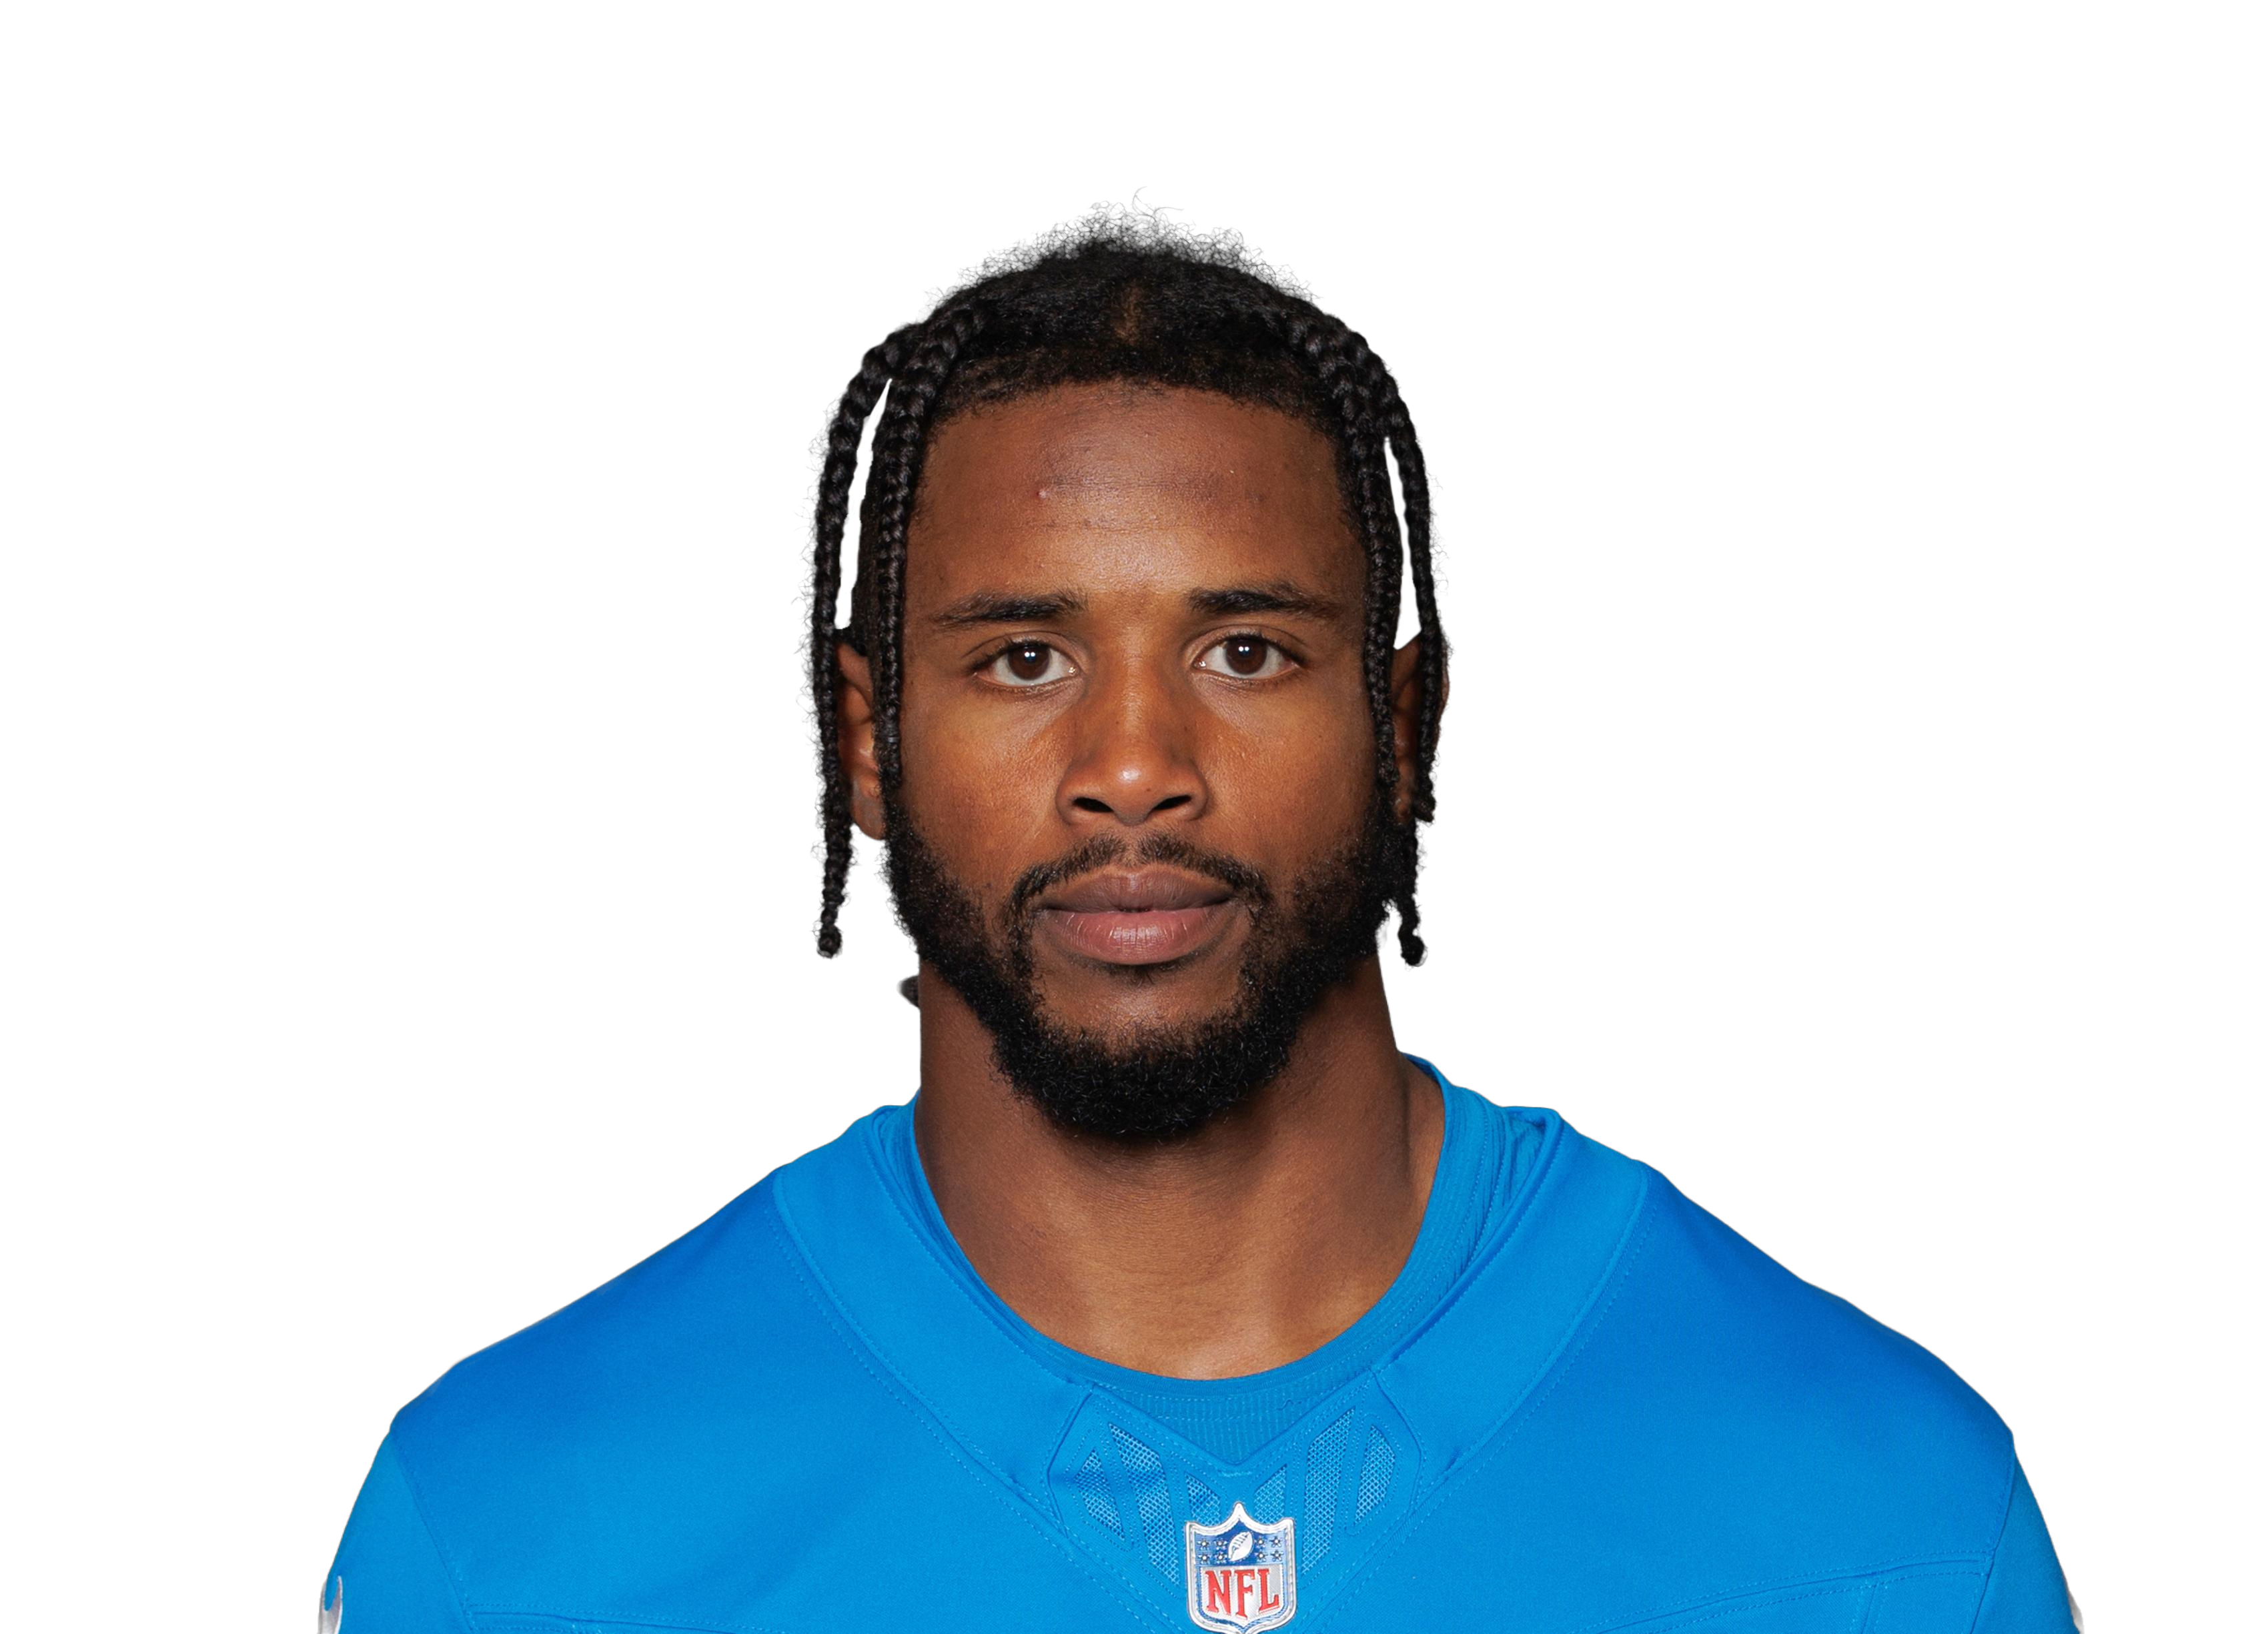 Donovan Peoples-Jones
|
CLE | 13 | 55 | 45.9 | 2.6 | 4.5 | 34 | 3 | 17.6 | 58.6% | 15.1% | 0.42 | |
| 51 |
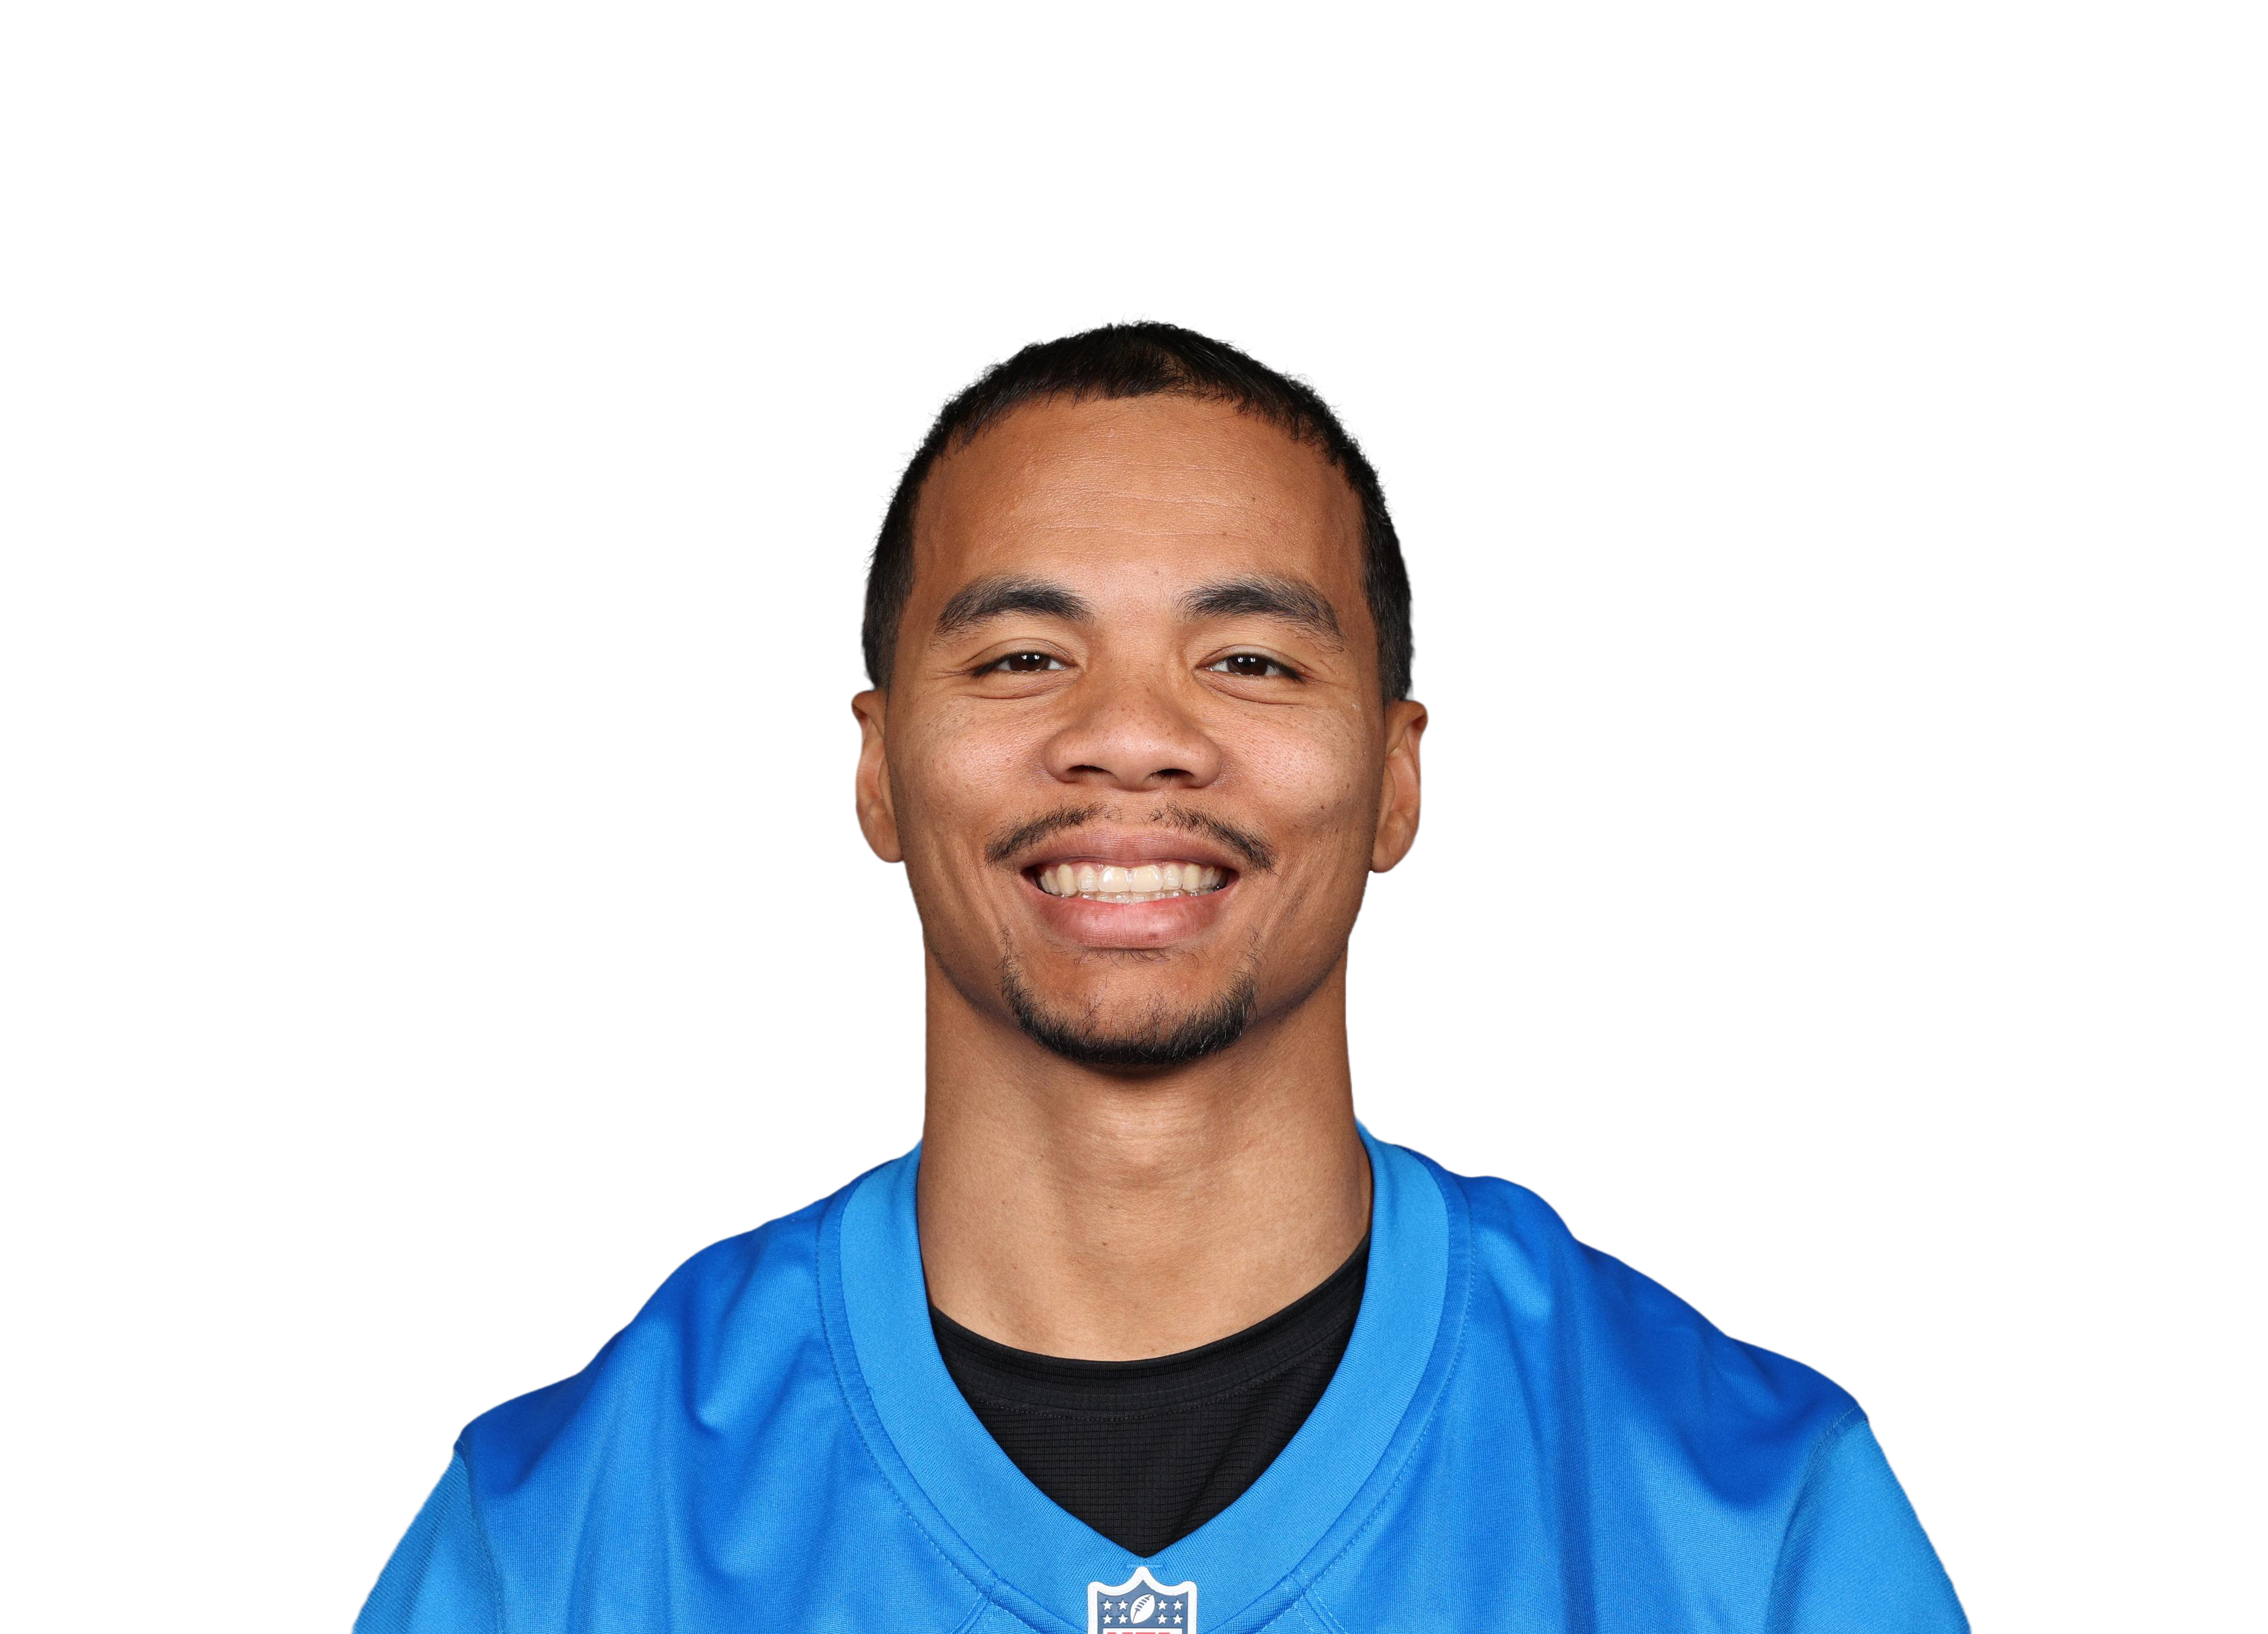 Kalif Raymond
|
DET | 16 | 55 | 36.0 | 3.0 | 4.4 | 48 | 4 | 12.0 | 67.6% | 14.0% | 0.37 | |
| 52 |
 DeAndre Hopkins
|
ARI | 10 | 67 | 57.2 | 4.2 | 6.4 | 42 | 8 | 13.6 | 65.6% | 20.3% | 0.53 | |
| 53 |
 Bryan Edwards
|
LV | 16 | 51 | 35.7 | 2.1 | 3.7 | 34 | 3 | 16.8 | 57.6% | 10.3% | 0.27 | |
| 54 |
 Jarvis Landry
|
CLE | 12 | 59 | 47.5 | 4.3 | 7.2 | 52 | 2 | 11.0 | 59.8% | 24.5% | 0.54 | |
| 55 |
 Deonte Harty
|
NO | 13 | 56 | 43.8 | 2.8 | 4.5 | 36 | 3 | 15.8 | 61.0% | 15.1% | 0.37 | |
| 56 |
 Byron Pringle
|
KC | 16 | 55 | 35.5 | 2.6 | 3.8 | 42 | 5 | 13.5 | 70.0% | 10.1% | 0.25 | |
| 57 |
 Robert Woods
|
LAR | 9 | 64 | 61.8 | 5.0 | 7.7 | 45 | 4 | 12.4 | 65.2% | 21.8% | 0.47 | |
| 58 |
 Gabe Davis
|
BUF | 15 | 56 | 36.6 | 2.3 | 4.2 | 35 | 6 | 15.7 | 55.6% | 11.3% | 0.29 | |
| 59 |
 Zay Jones
|
LV | 15 | 52 | 36.4 | 3.1 | 4.7 | 47 | 1 | 11.6 | 67.1% | 13.6% | 0.37 | |
| 60 |
 Antonio Brown
|
TB | 7 | 71 | 77.9 | 6.0 | 8.9 | 42 | 4 | 13.0 | 67.7% | 23.1% | 0.55 |
What this is. Finished box-score production from 2021, ranked by Rec yards. Per-game columns divide by games played, not games on the schedule, so a player who missed time is measured on the games he was in — and his season totals still show the games he missed. Minimum 4 games to be ranked, otherwise one big afternoon tops every list.
What it isn’t. None of this is a projection, a pick, or a prop recommendation — it is what already happened. Last season’s rate is a starting point for what a player does in a game, not a forecast of the next one: offense, role, and health all move underneath it. Target share and WOPR describe a player’s share of his own team’s passing game, so they compare roles, not players across teams.
About the grade. 0–100, where 50 is average for the position and 85+ is elite. It is box production, scaled by the defense it came against, pulled toward the positional average when a player has few games, then ranked within position — so a 90 quarterback and a 90 kicker are each elite for their own spot and are not comparable to each other in any other way. It needs 6 games, so players below that show — rather than a number built on a hot month.
What the grade can’t see. There is no charting behind it, so it rewards production over technique: the receiver who ran the route that freed someone else, and the back who picked up the blitz, get nothing for it. It is role-dependent by construction — a back on a run-heavy team gets more chances than an equally good back who touches it half as often. Kickers are not opponent-adjusted, because field goals are contested by distance and weather, not by the defense across the ball. And it grades a season already played; it is not a projection of the next one.
Regular season and postseason are kept separate on purpose. Playoff samples are small and the opponents are better; blending them into a season rate quietly flatters the players who got there. The grade is regular-season only, so it is not offered on the postseason split.