Players 2018 final postseason


Tight ends — 2018 · ranked by Rec yards
| # | Player | Tm | G | Yds/gm | Rec/gm | Tgt/gm | Rec yds | Rec | TD | Y/R | Catch% | Tgt share | WOPR |
|---|---|---|---|---|---|---|---|---|---|---|---|---|---|
| 1 |
Rob Gronkowski
|
NE | 3 | 63.7 | 4.3 | 6.3 | 13 | 0 | 14.7 | 68.4% | 15.4% | 0.35 | |
| 2 |
Travis Kelce
|
KC | 2 | 65.5 | 5.0 | 8.0 | 10 | 1 | 13.1 | 62.5% | 22.5% | 0.47 | |
| 3 |
Zach Ertz
|
PHI | 2 | 51.0 | 5.0 | 7.5 | 10 | 0 | 10.2 | 66.7% | 21.7% | 0.48 | |
| 4 |
Eric Ebron
|
IND | 2 | 38.5 | 4.0 | 7.5 | 8 | 1 | 9.6 | 53.3% | 22.2% | 0.51 | |
| 5 |
Antonio Gates
|
LAC | 2 | 38.0 | 4.5 | 6.0 | 9 | 1 | 8.4 | 75.0% | 15.4% | 0.32 | |
| 6 |
 Tyler Higbee
|
LAR | 2 | 27.5 | 3.0 | 4.0 | 6 | 1 | 9.2 | 75.0% | 12.5% | 0.25 | |
| 7 |
 Gerald Everett
|
LAR | 3 | 16.7 | 0.7 | 2.3 | 2 | 0 | 25.0 | 28.6% | 6.8% | 0.17 | |
| 8 |
 Ed Dickson
|
SEA | 1 | 42.0 | 4.0 | 5.0 | 4 | 0 | 10.5 | 80.0% | 18.5% | 0.35 | |
| 9 |
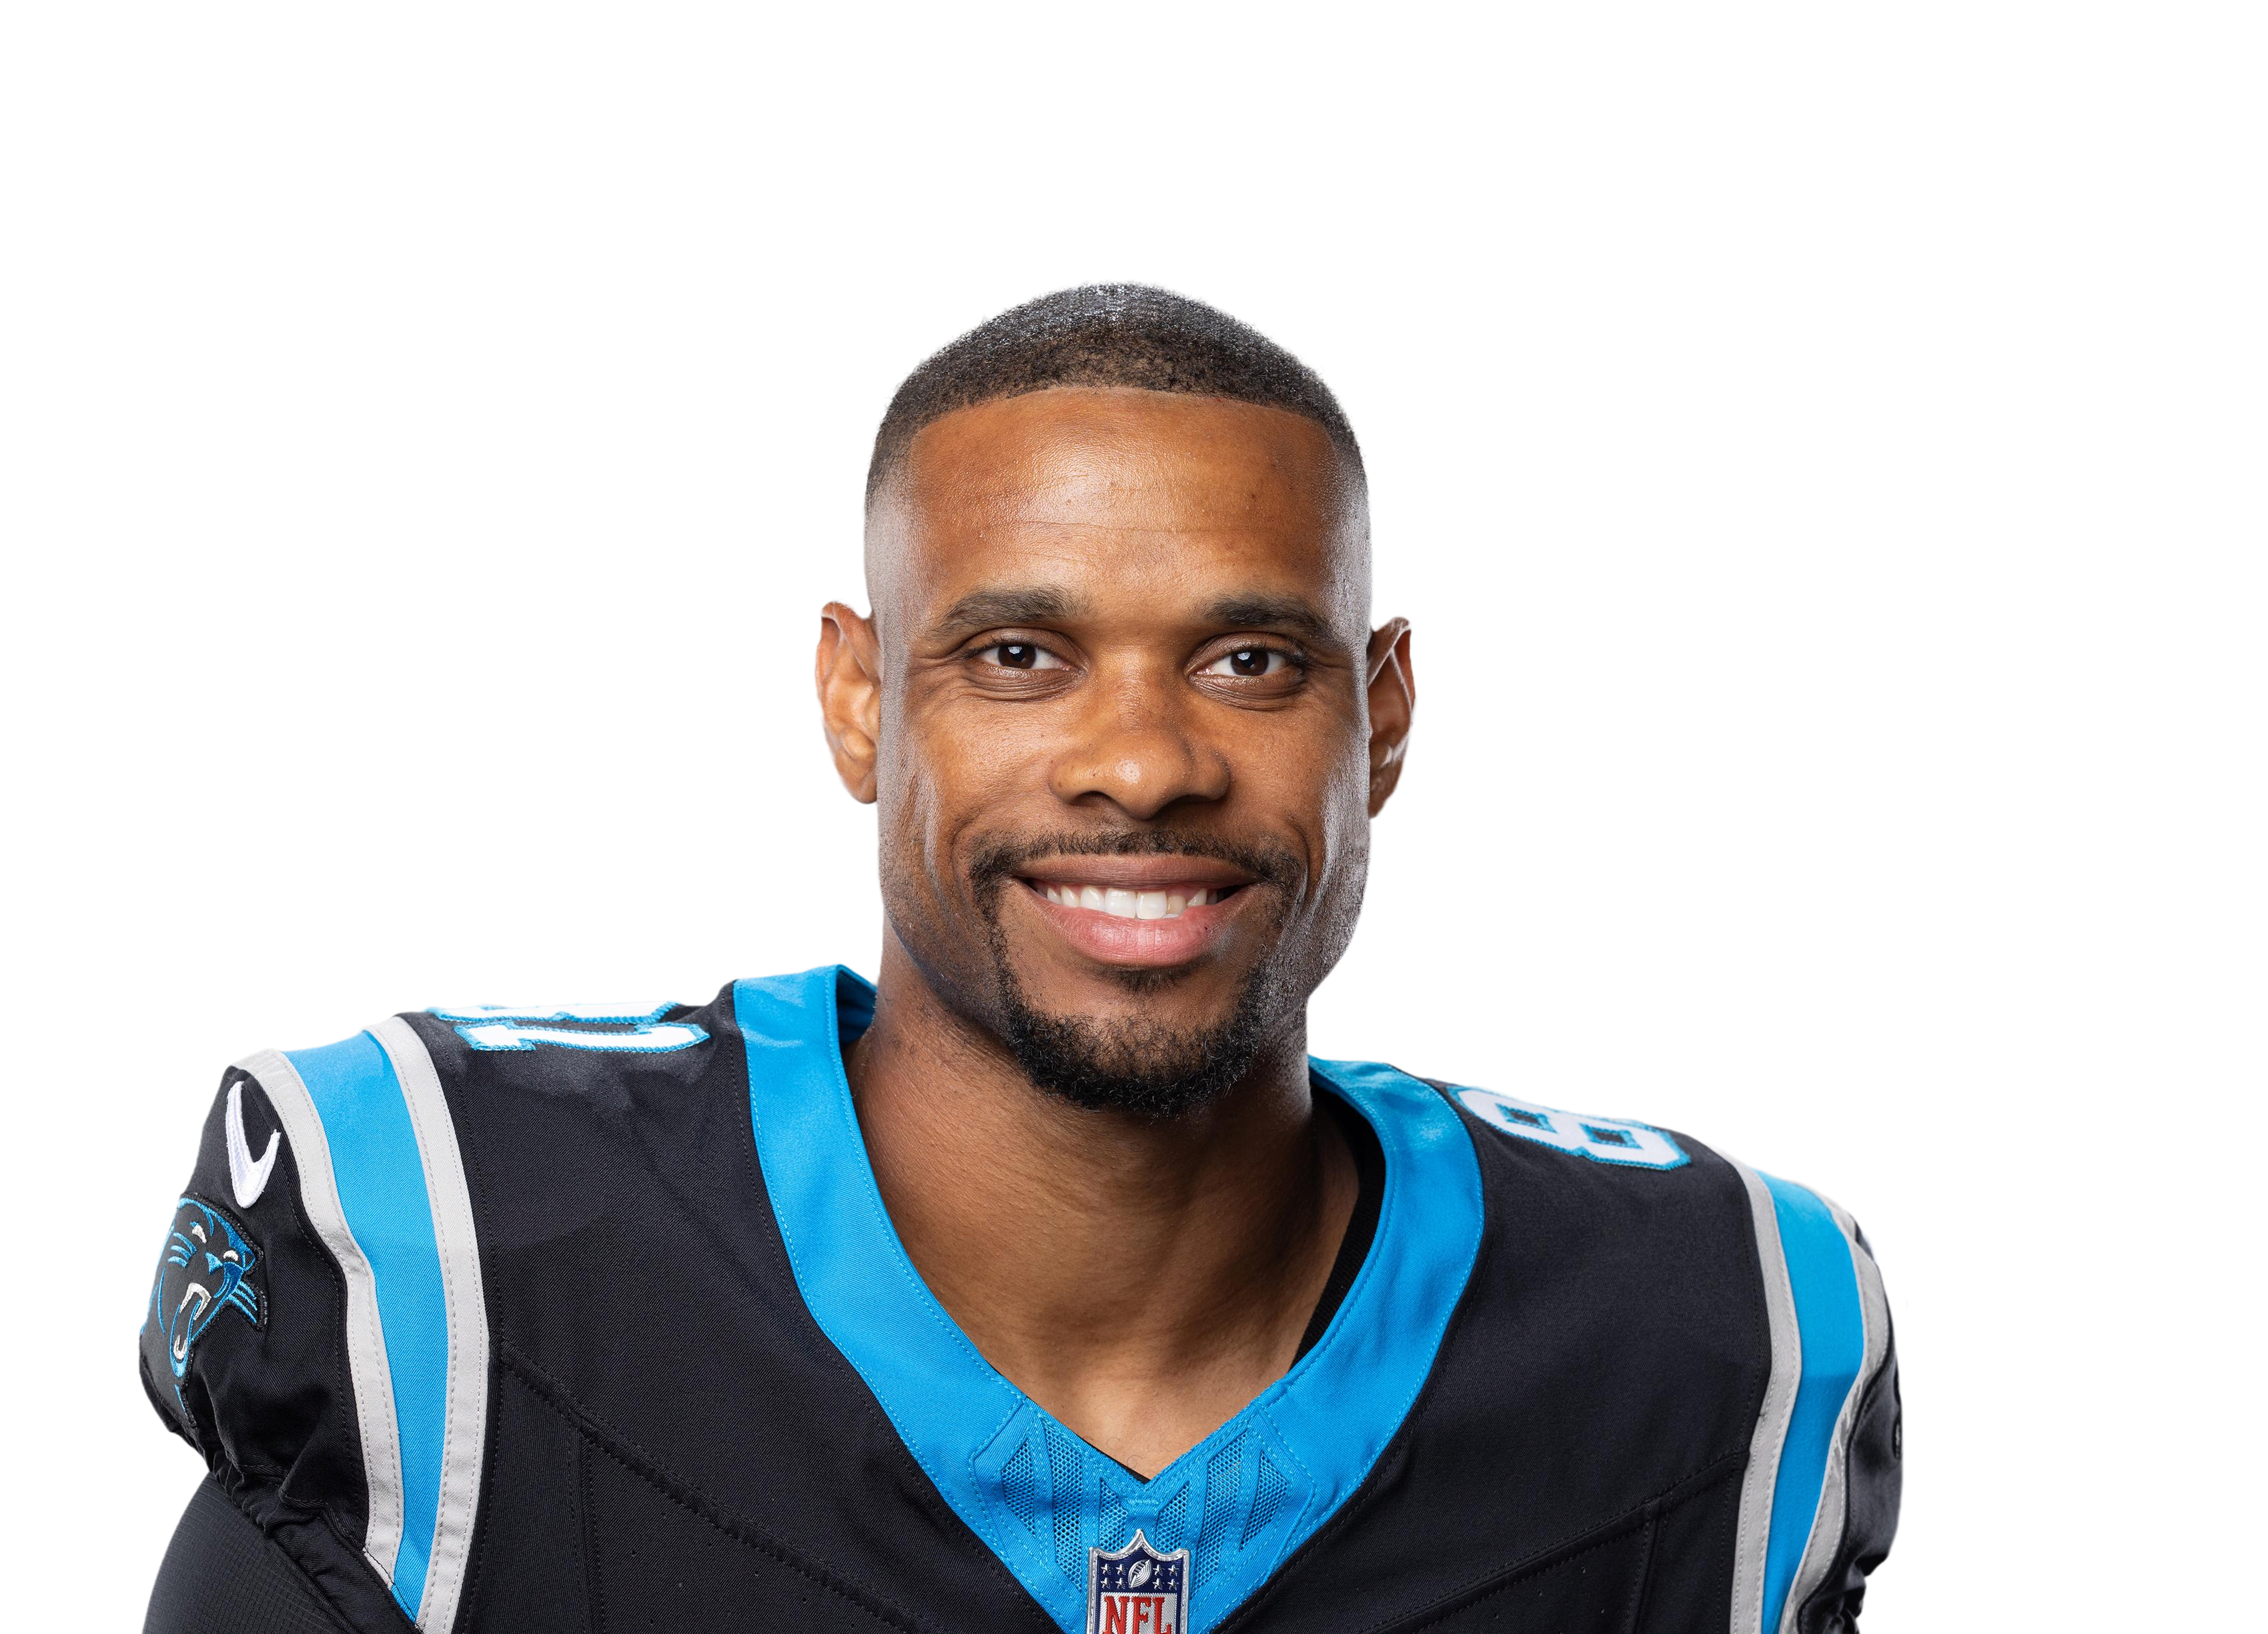 Jordan Matthews
|
PHI | 1 | 37.0 | 1.0 | 2.0 | 1 | 1 | 37.0 | 50.0% | 6.5% | 0.19 | |
| 10 |
 Blake Jarwin
|
DAL | 2 | 16.0 | 2.5 | 2.5 | 5 | 0 | 6.4 | 100.0% | 7.8% | 0.13 | |
| 11 |
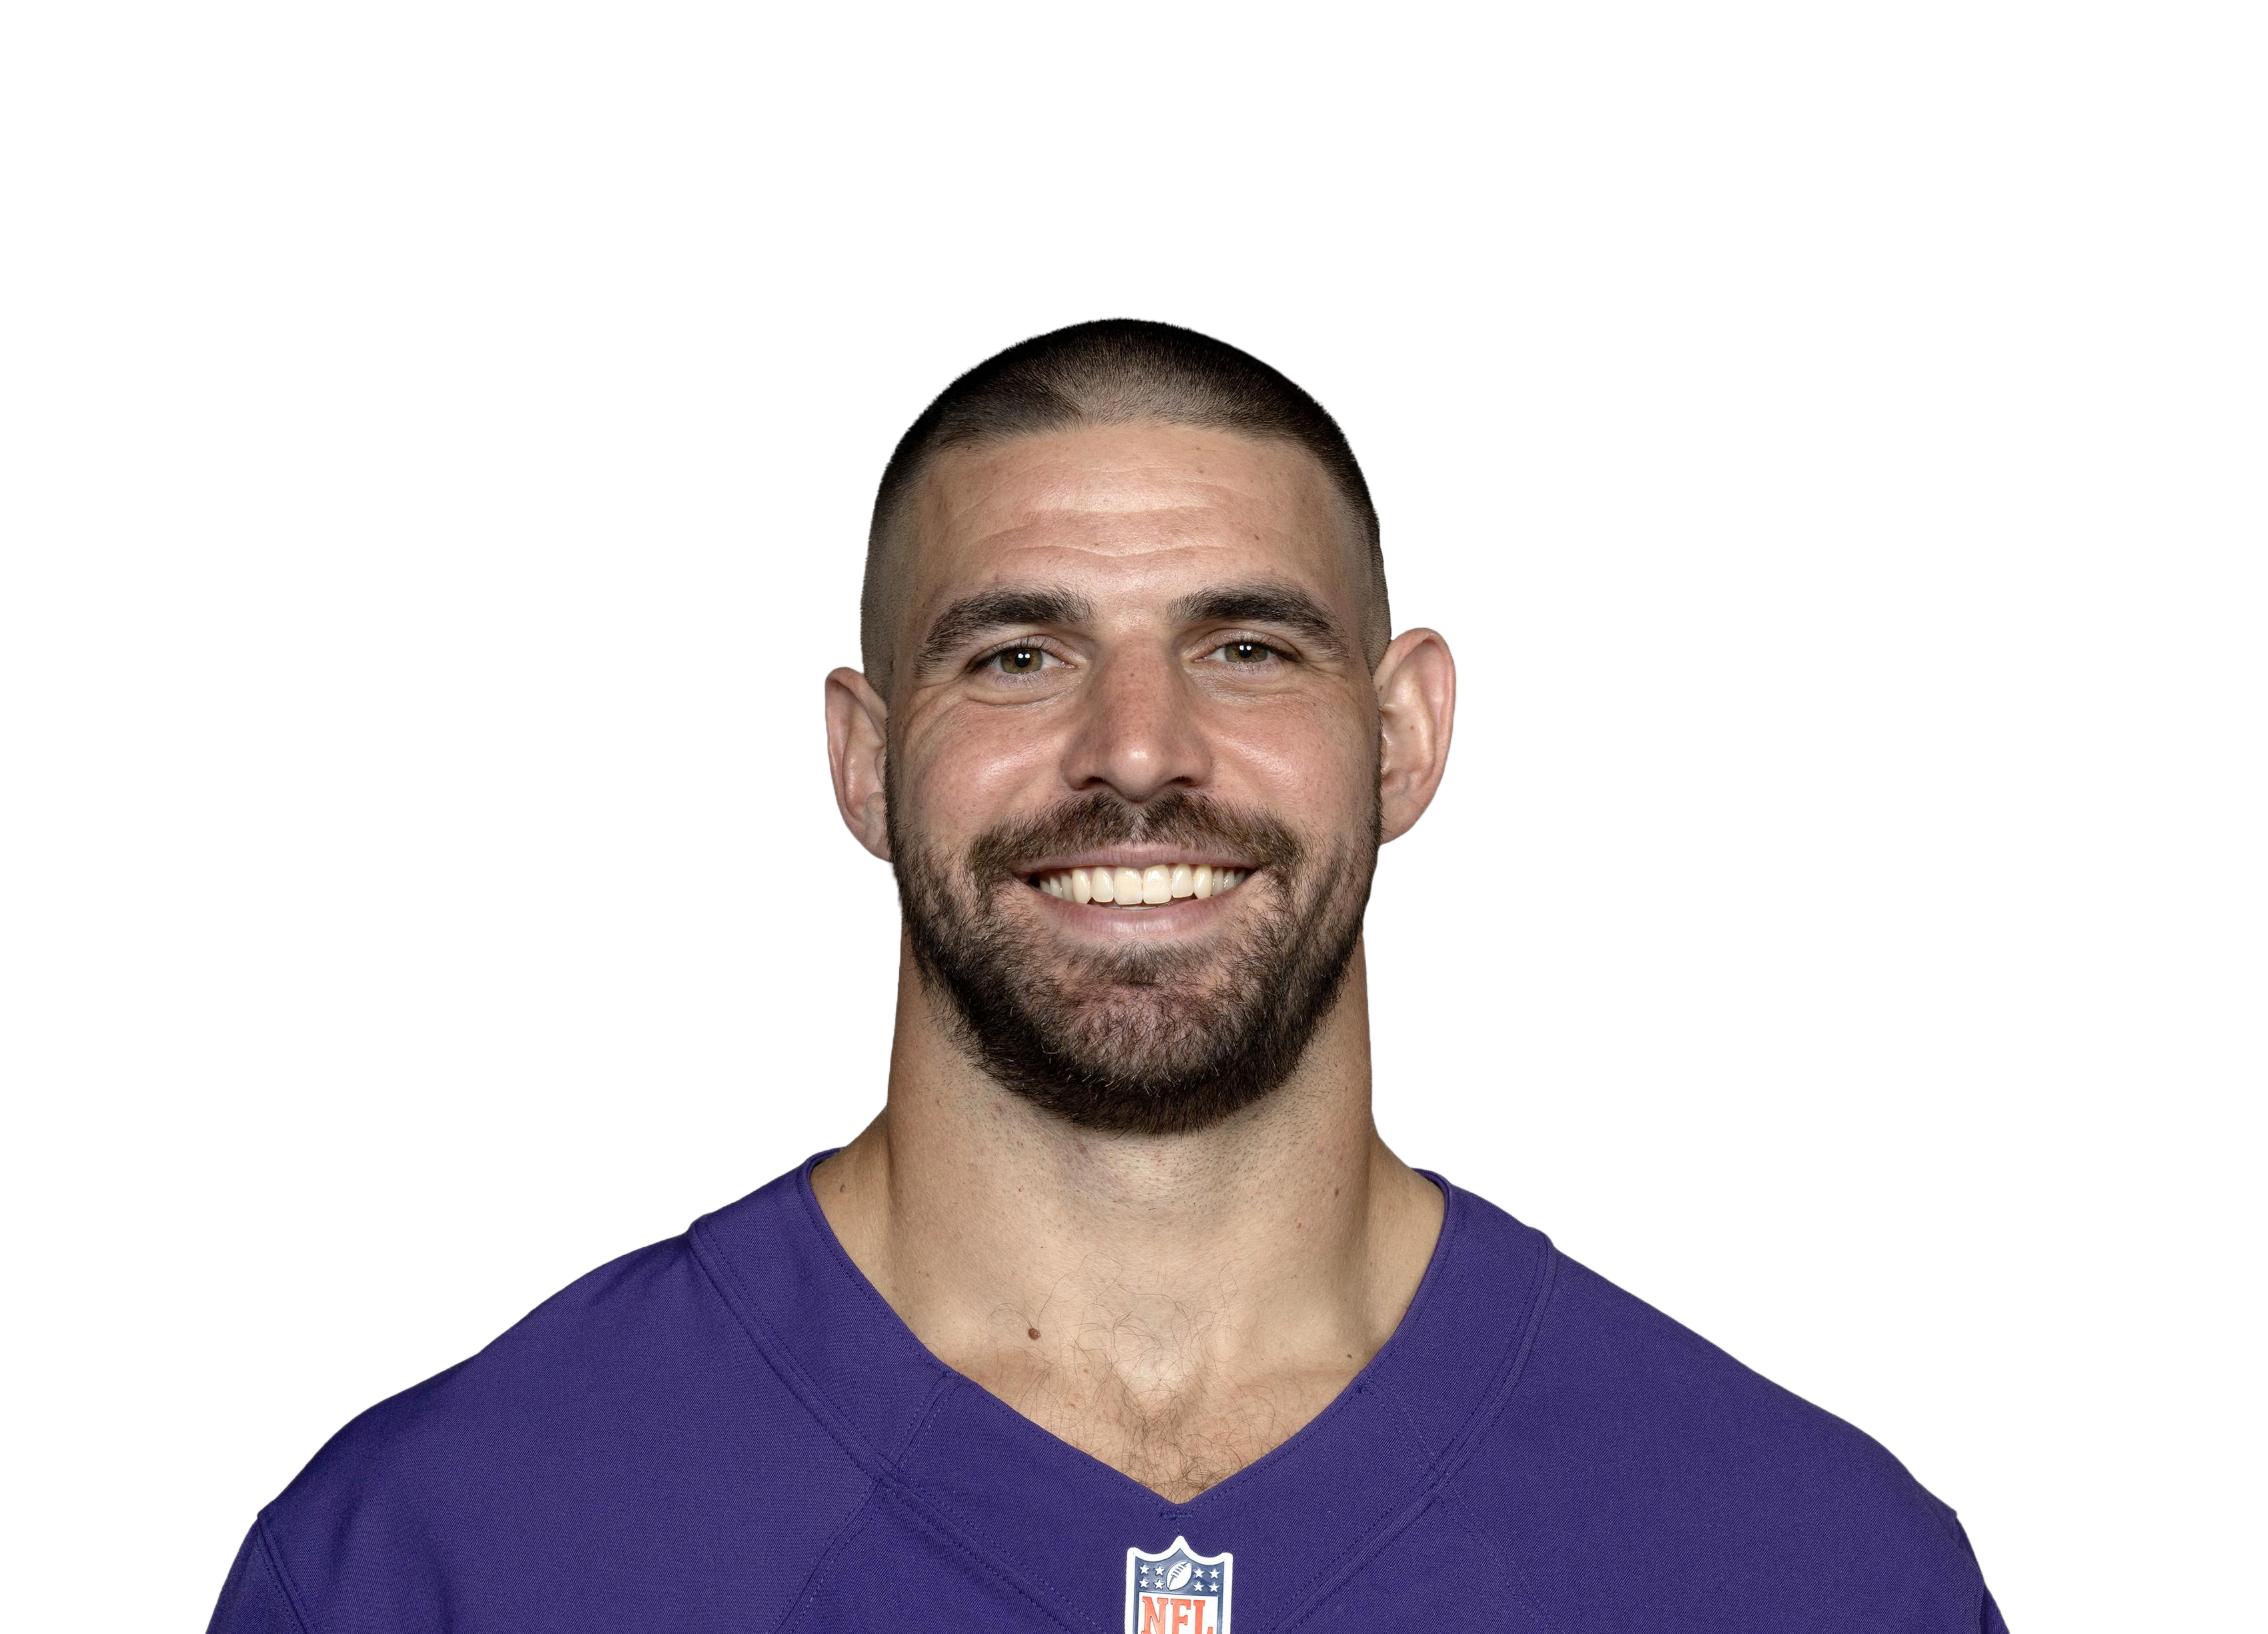 Mark Andrews
|
BAL | 1 | 31.0 | 3.0 | 7.0 | 3 | 0 | 10.3 | 42.9% | 26.9% | 0.56 | |
| 12 |
 Josh Hill
|
NO | 2 | 15.5 | 2.0 | 2.0 | 4 | 0 | 7.8 | 100.0% | 5.3% | 0.07 | |
| 13 |
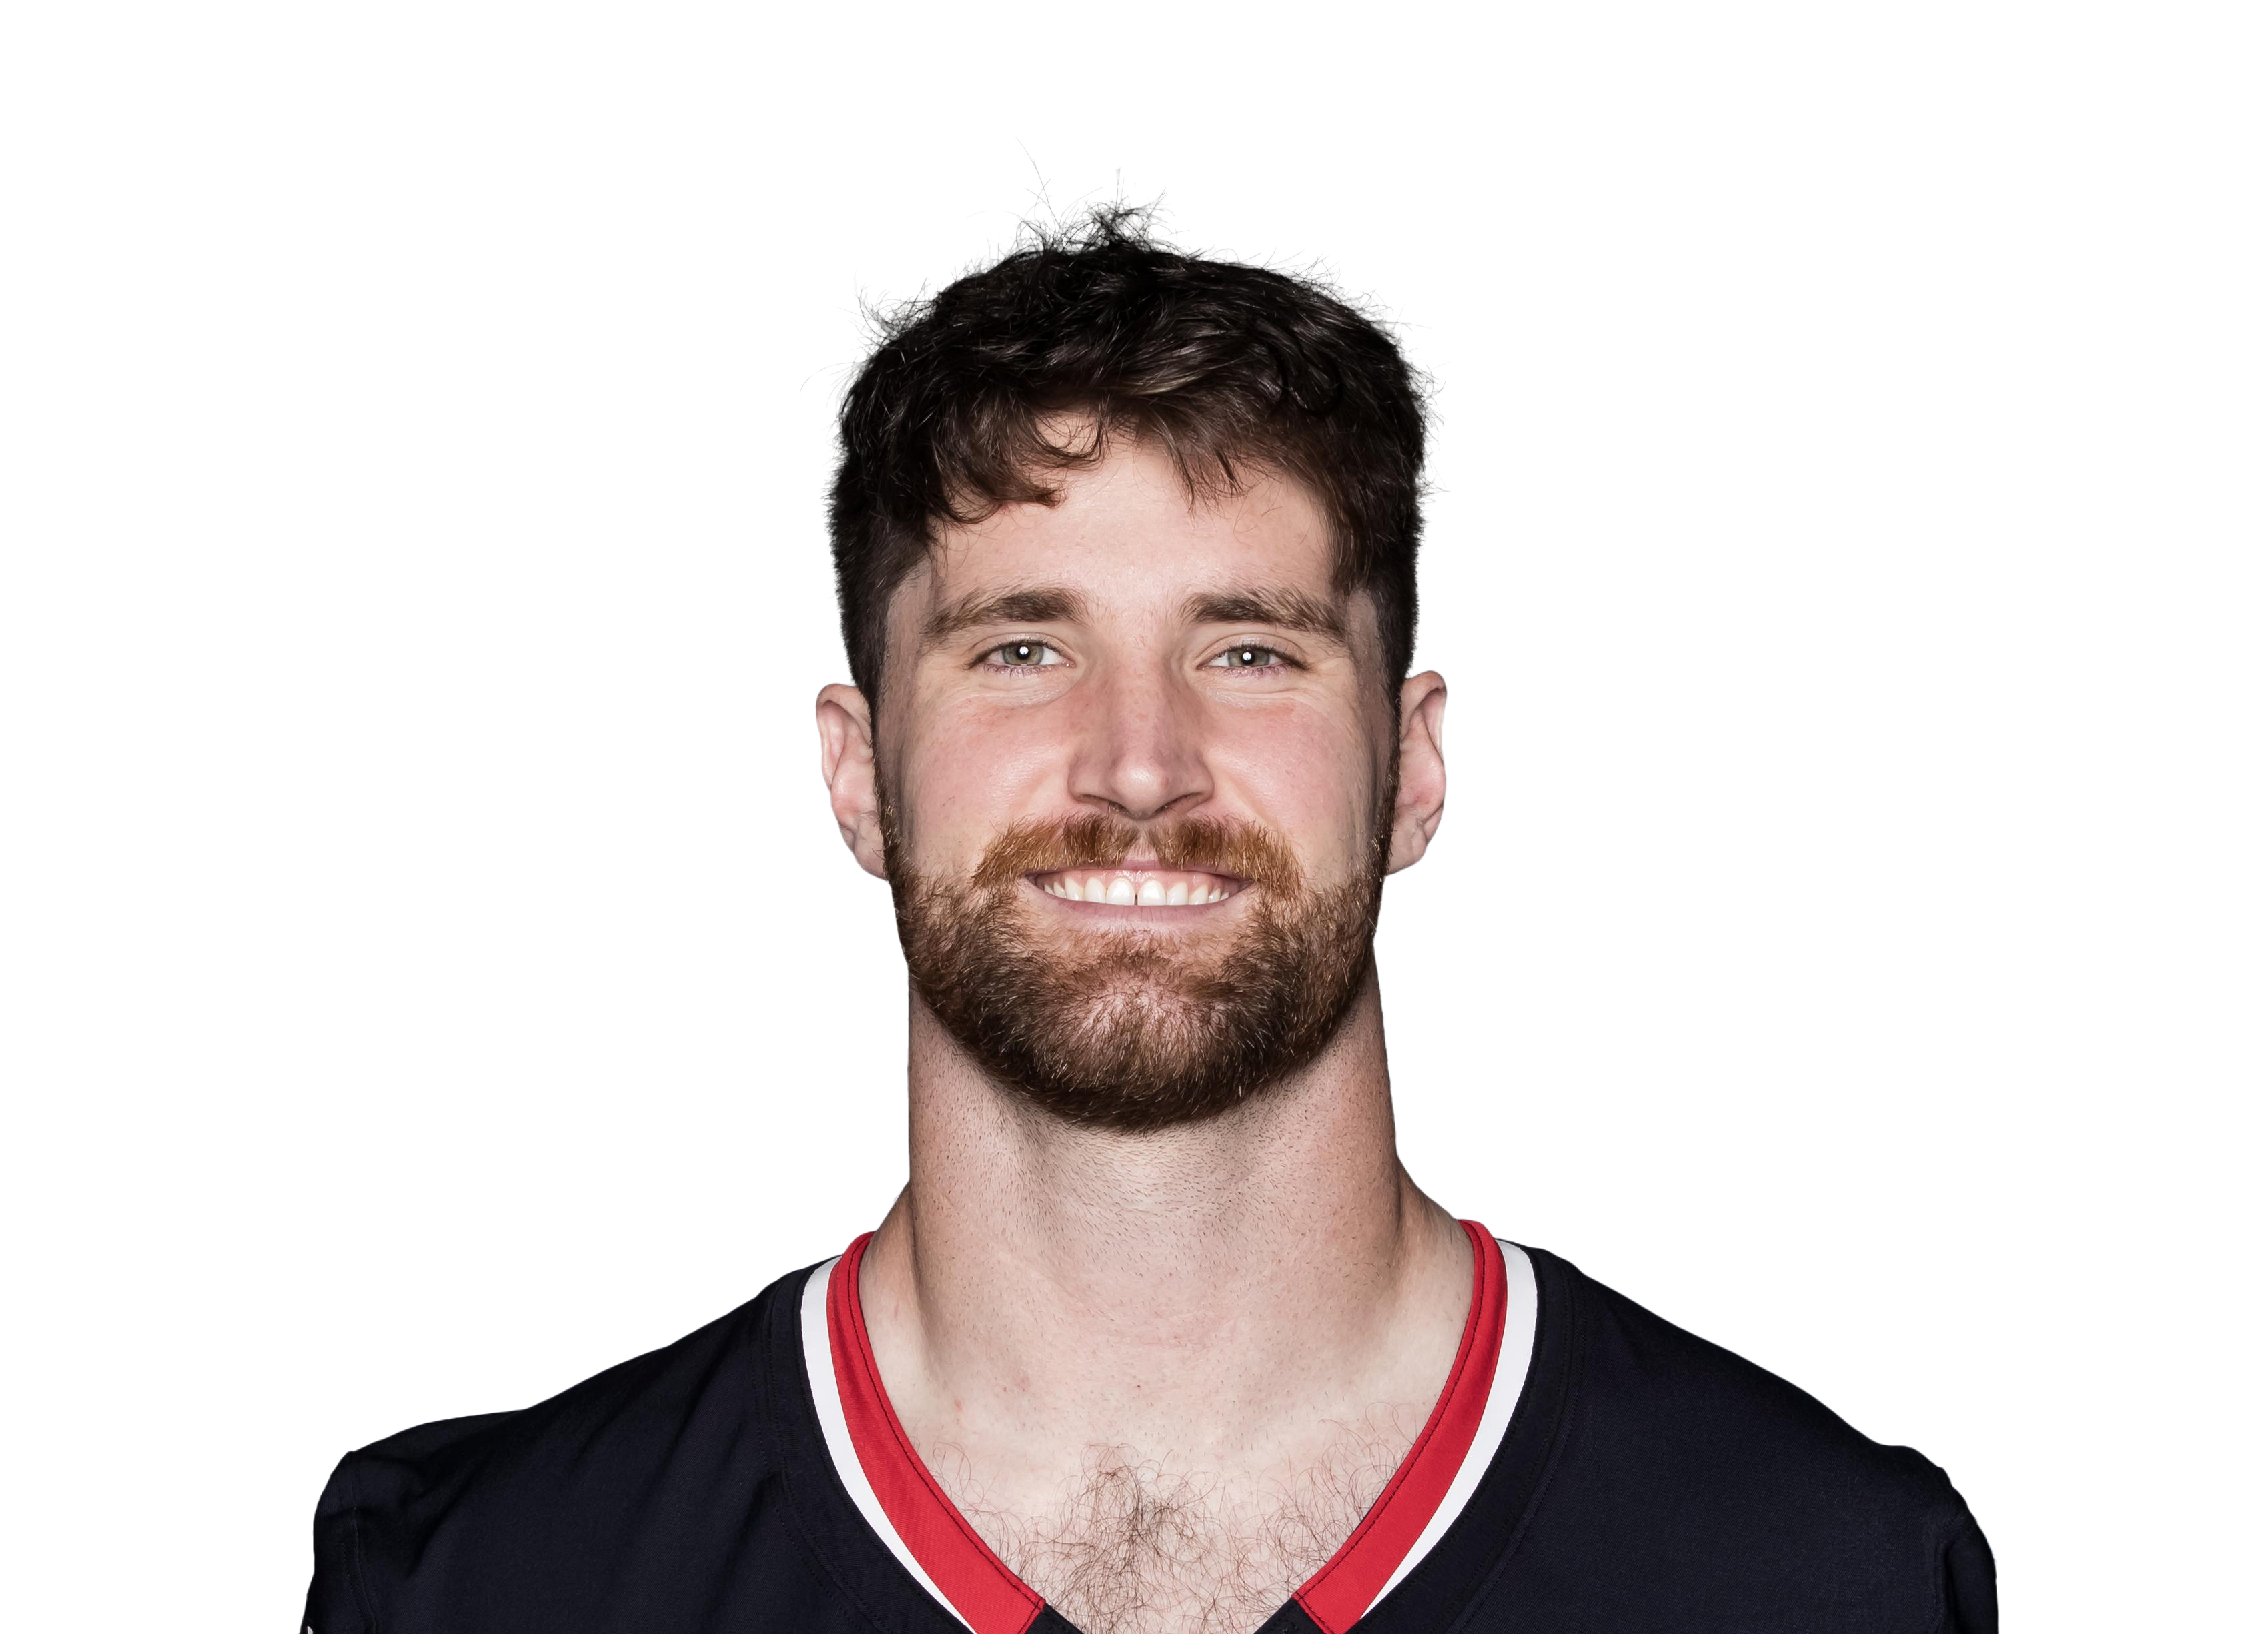 Dalton Schultz
|
DAL | 2 | 10.0 | 0.5 | 1.0 | 1 | 0 | 20.0 | 50.0% | 3.1% | 0.09 | |
| 14 |
 Dallas Goedert
|
PHI | 2 | 10.0 | 1.0 | 2.0 | 2 | 1 | 10.0 | 50.0% | 5.0% | 0.10 | |
| 15 |
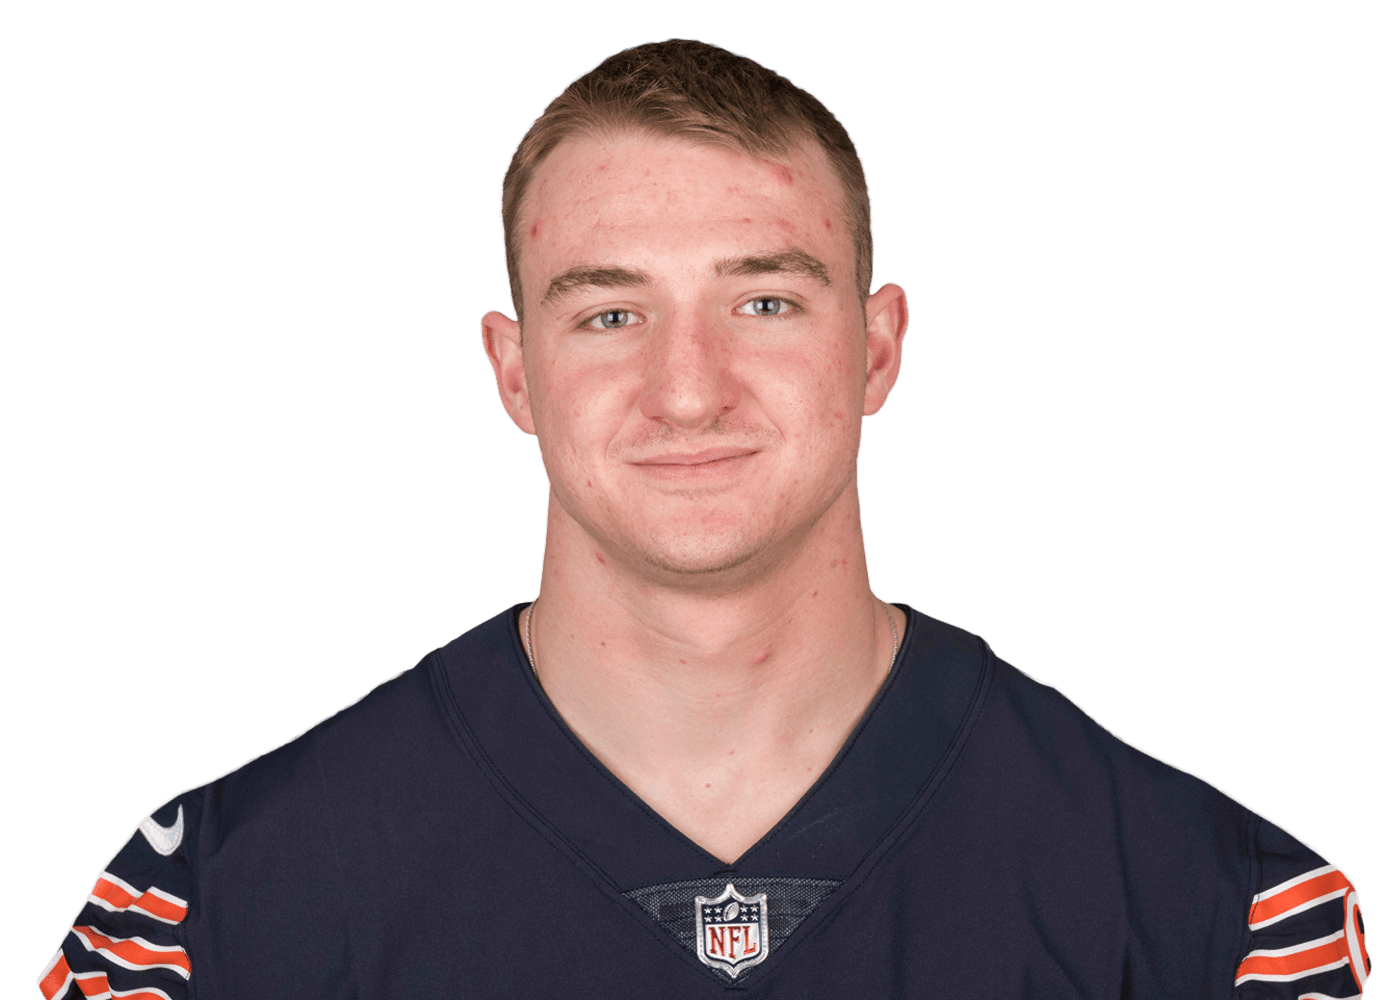 Ben Braunecker
|
CHI | 1 | 15.0 | 2.0 | 2.0 | 2 | 0 | 7.5 | 100.0% | 4.9% | 0.08 | |
| 16 |
 Adam Shaheen
|
CHI | 1 | 13.0 | 3.0 | 4.0 | 3 | 0 | 4.3 | 75.0% | 9.8% | 0.18 | |
| 17 |
 Garrett Griffin
|
NO | 1 | 12.0 | 2.0 | 2.0 | 2 | 1 | 6.0 | 100.0% | 5.1% | 0.08 | |
| 18 |
 Benjamin Watson
|
NO | 1 | 12.0 | 1.0 | 1.0 | 1 | 0 | 12.0 | 100.0% | 2.7% | 0.05 | |
| 19 |
 Virgil Green
|
LAC | 2 | 4.5 | 1.0 | 1.0 | 2 | 1 | 4.5 | 100.0% | 2.8% | 0.05 | |
| 20 |
 Maxx Williams
|
BAL | 1 | 8.0 | 1.0 | 1.0 | 1 | 0 | 8.0 | 100.0% | 3.8% | 0.05 | |
| 21 |
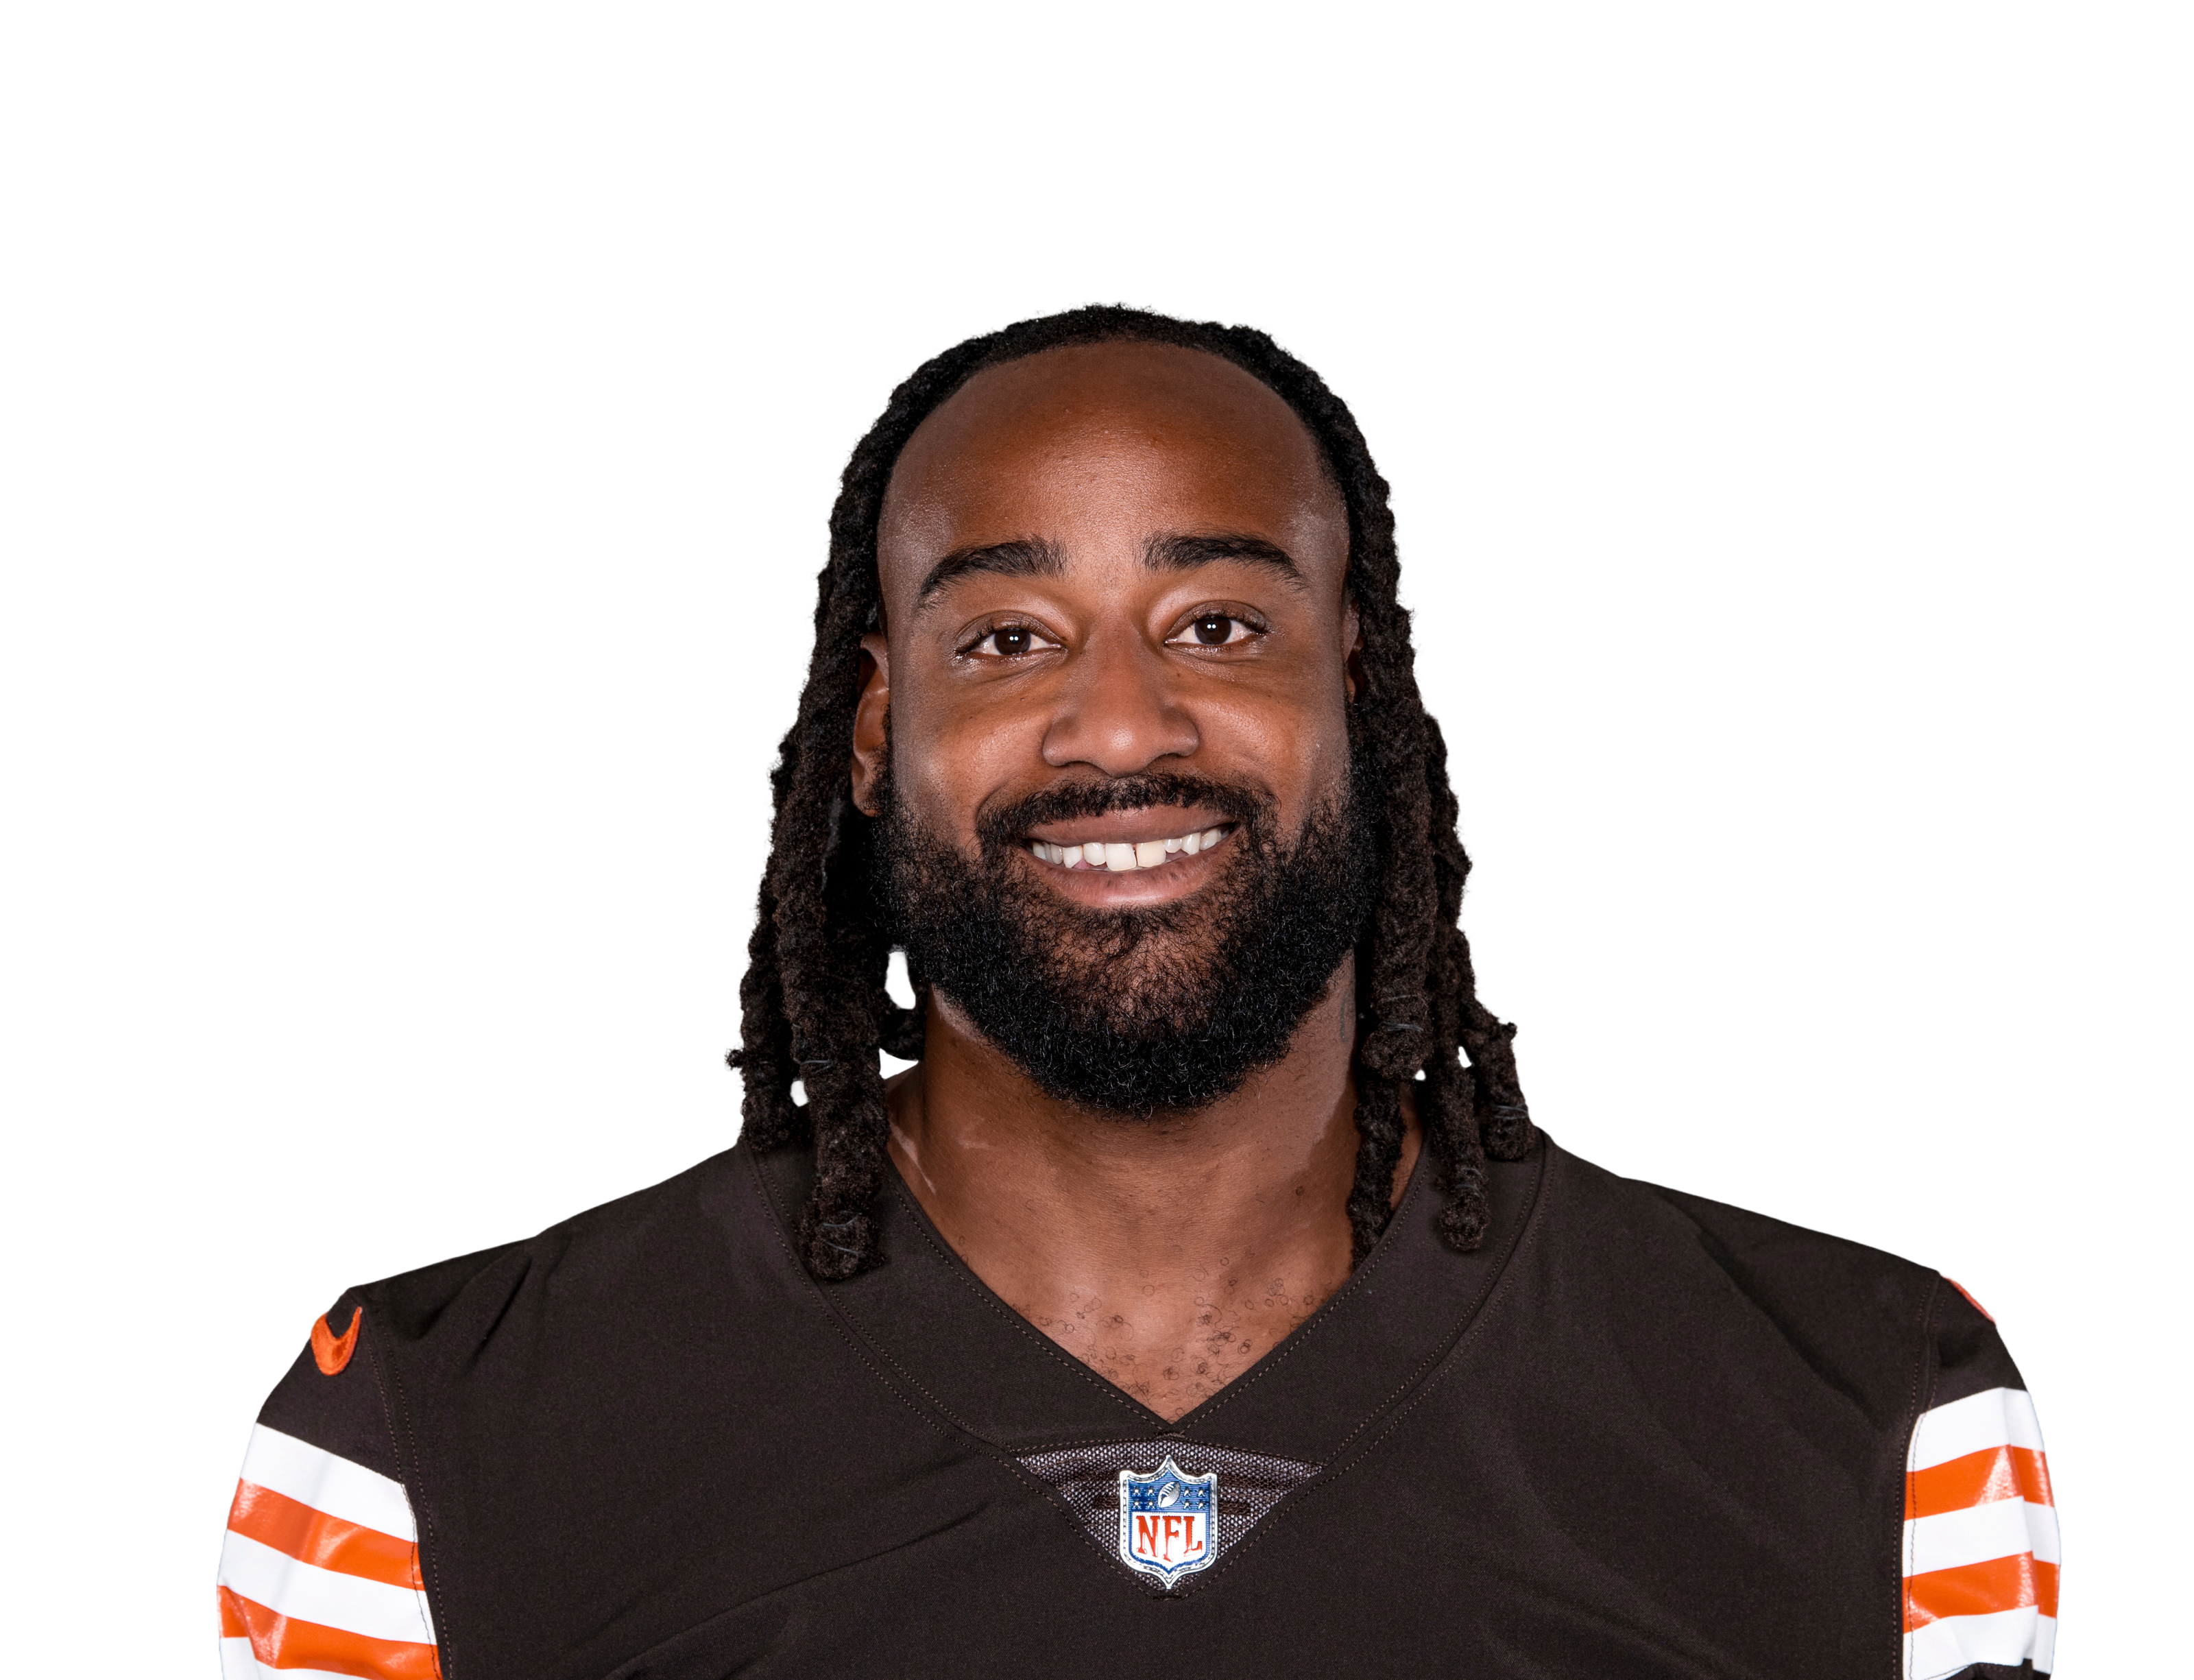 Jordan Akins
|
HOU | 1 | 8.0 | 2.0 | 3.0 | 2 | 0 | 4.0 | 66.7% | 6.4% | 0.12 | |
| 22 |
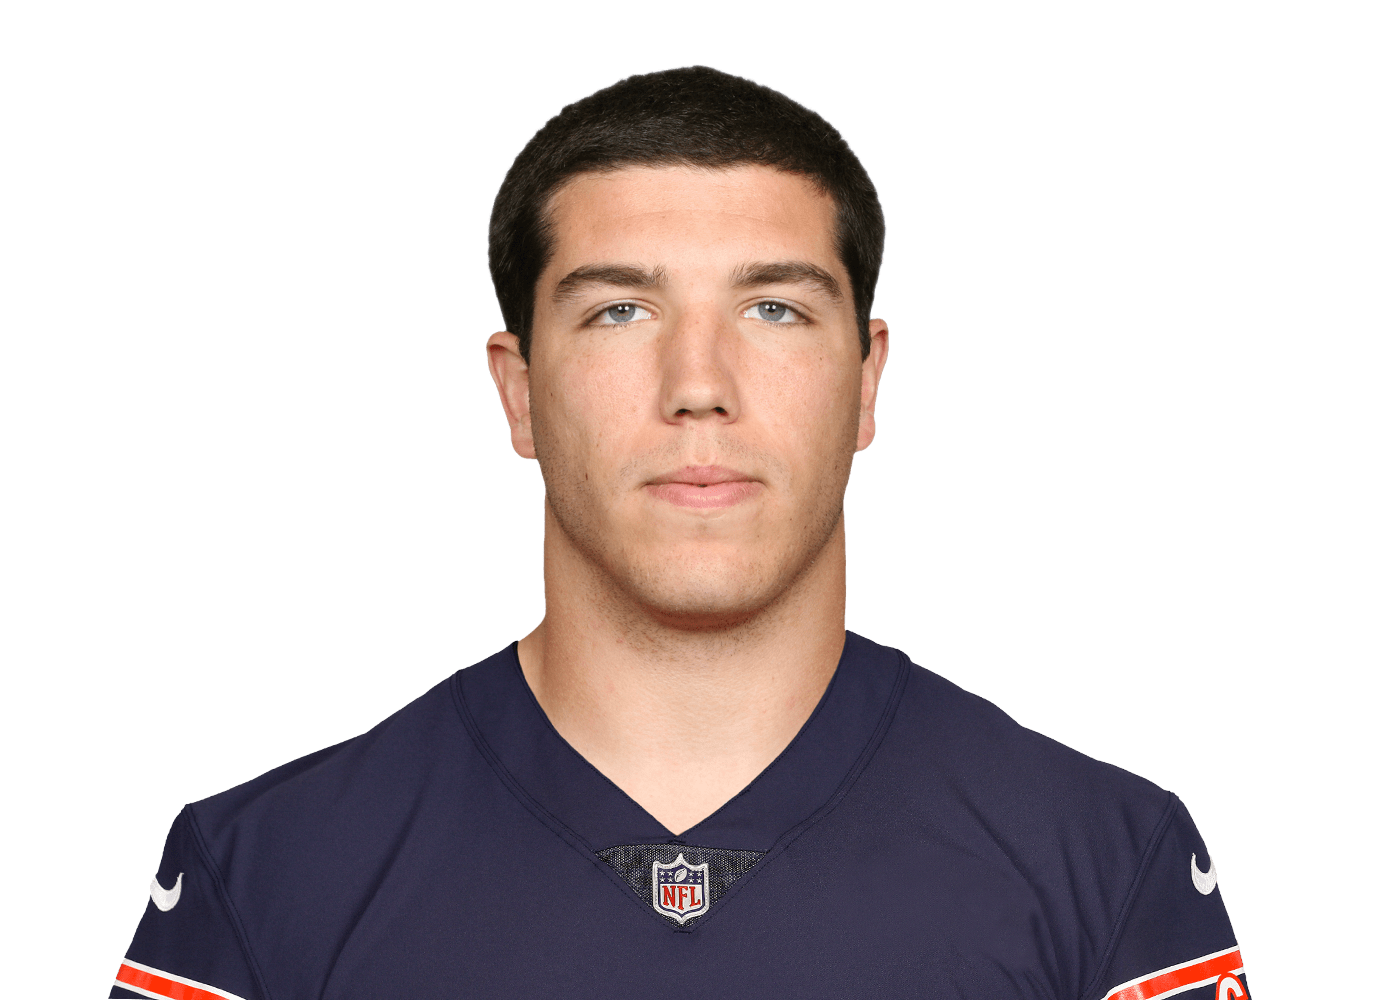 Ryan Griffin
|
HOU | 1 | 6.0 | 1.0 | 5.0 | 1 | 0 | 6.0 | 20.0% | 10.6% | 0.26 | |
| 23 |
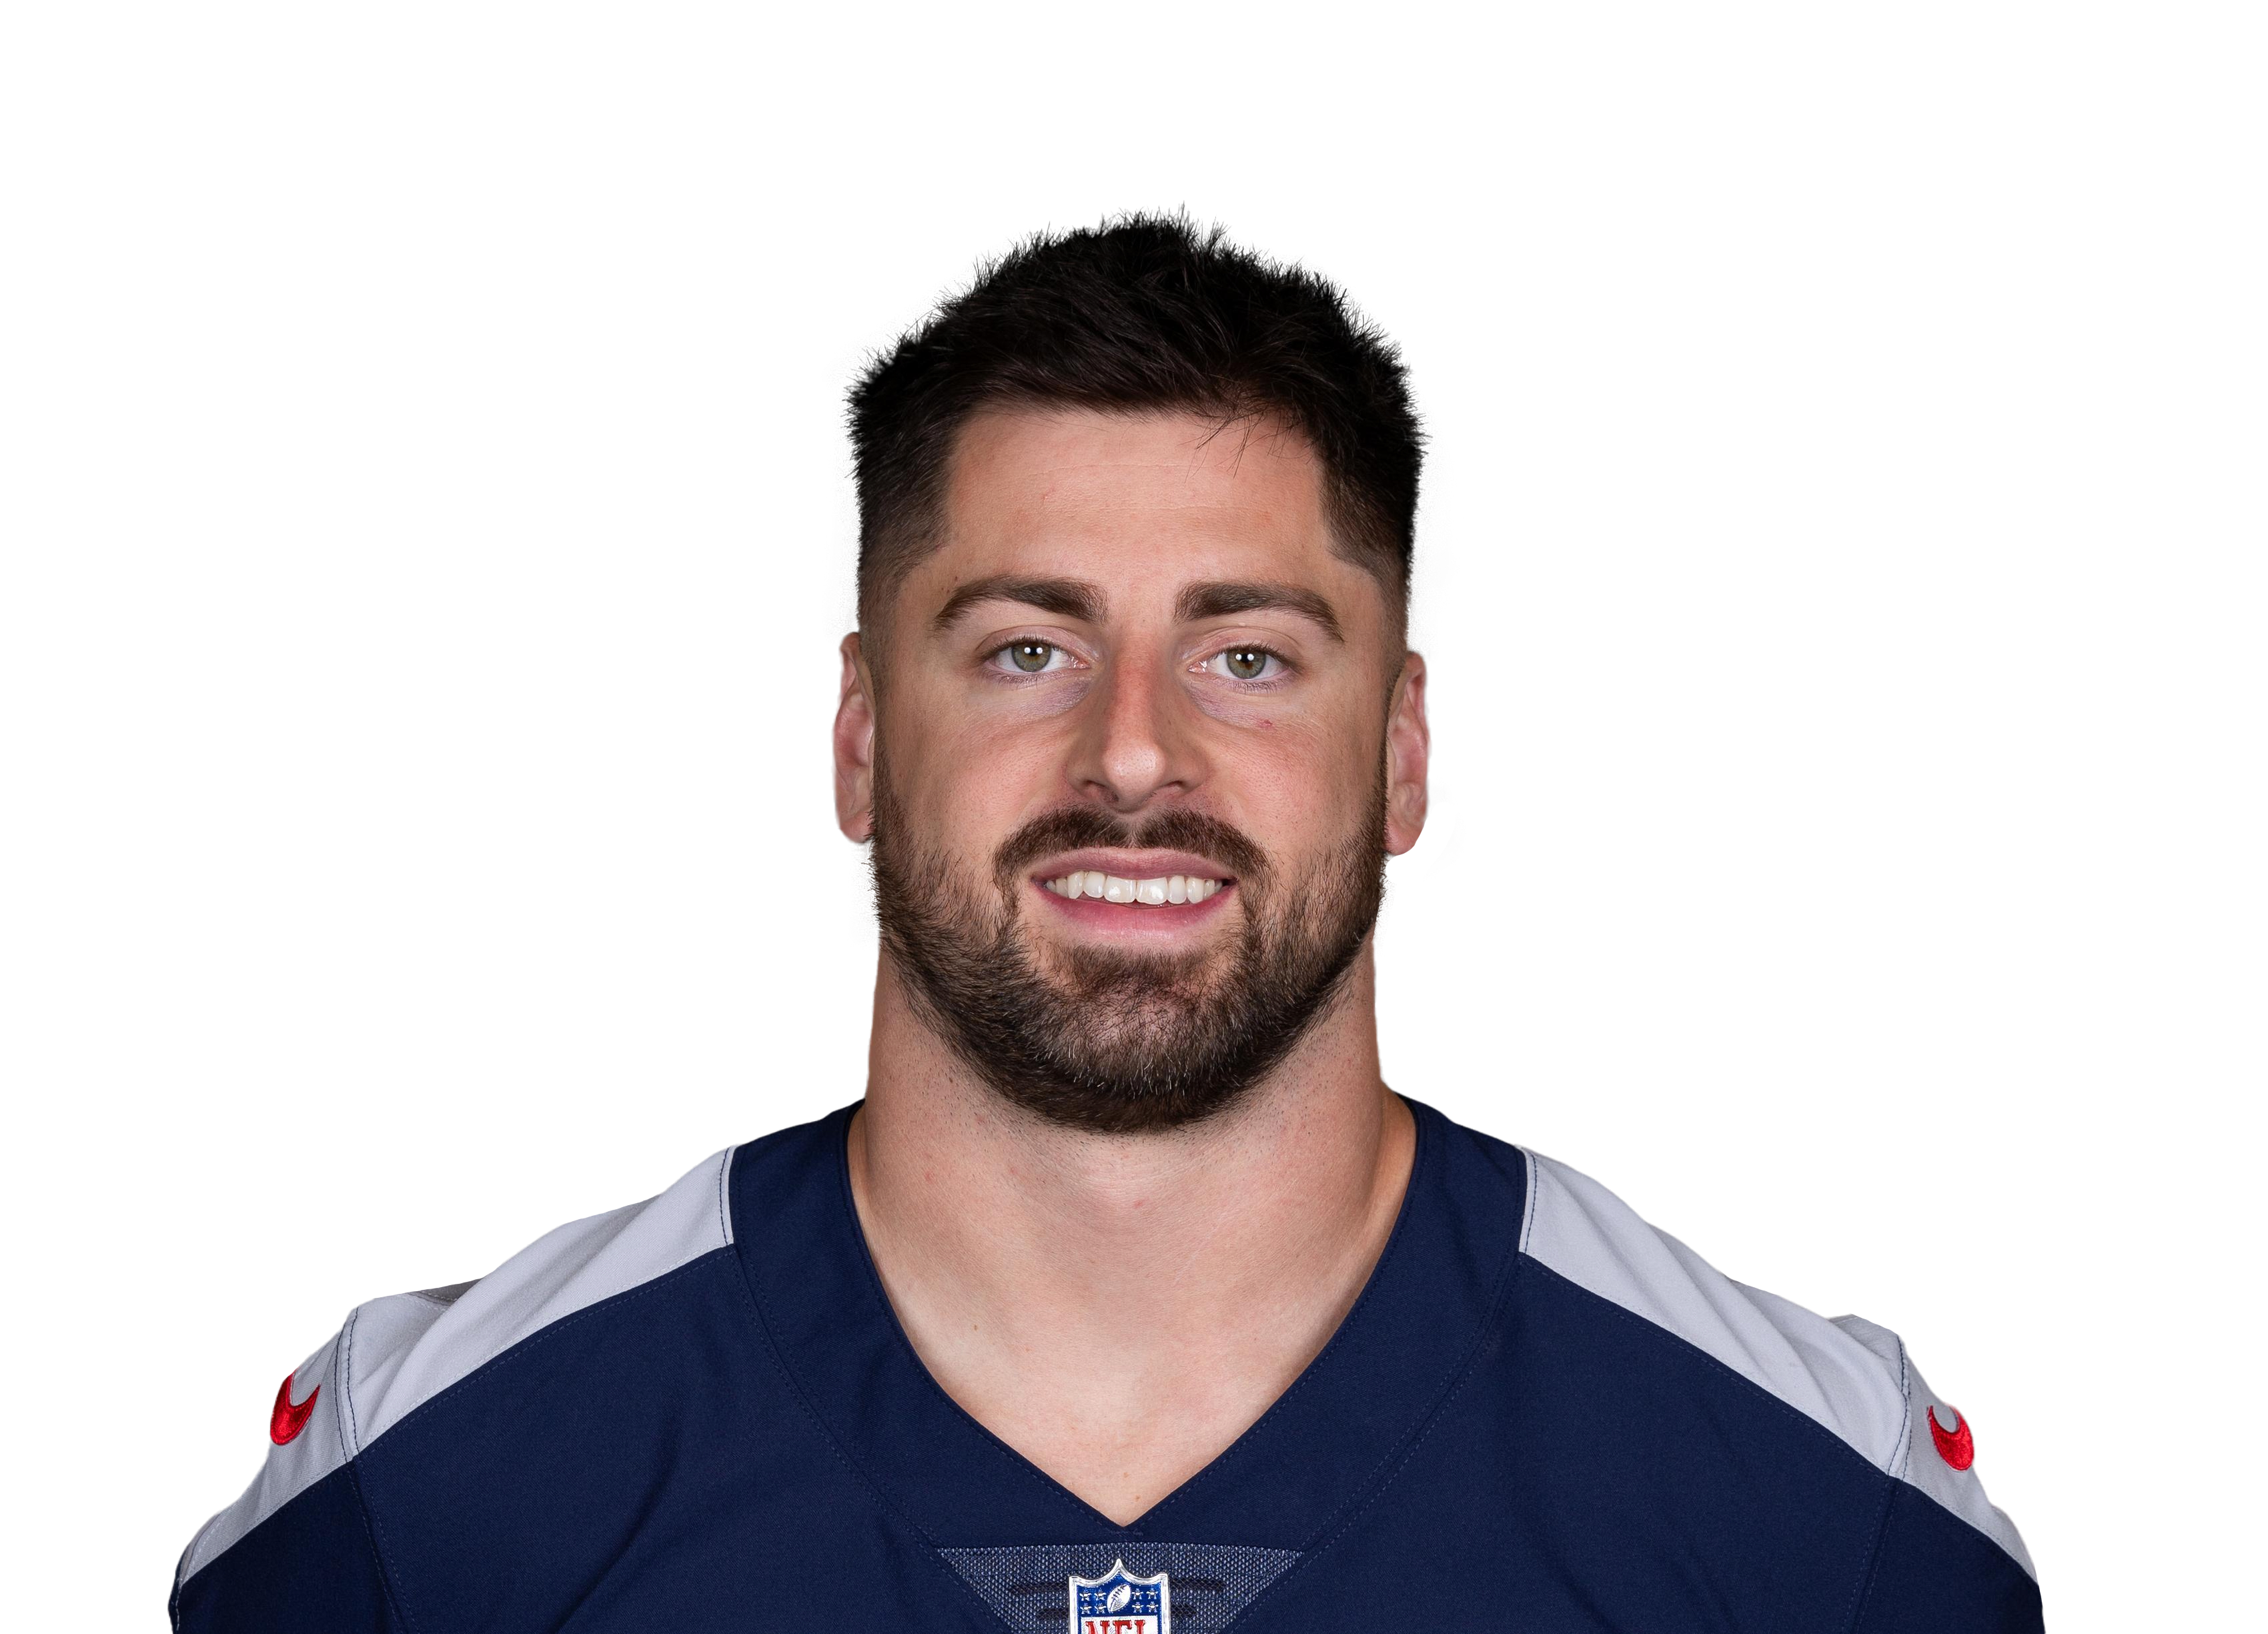 Nick Vannett
|
SEA | 1 | 5.0 | 1.0 | 2.0 | 1 | 0 | 5.0 | 50.0% | 7.4% | 0.15 | |
| 24 |
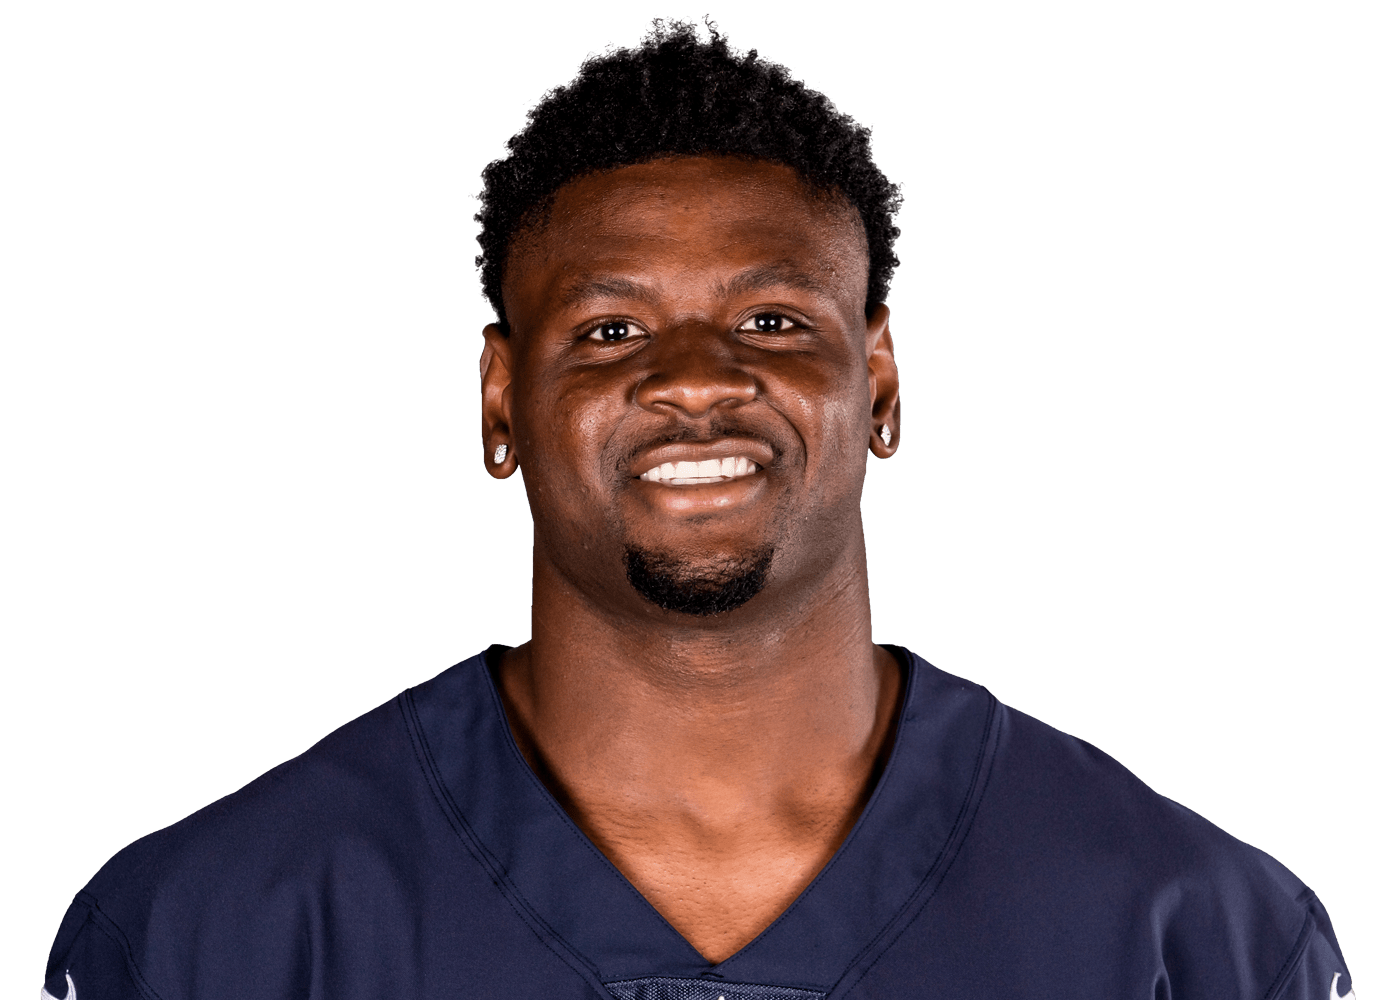 Demetrius Harris
|
KC | 2 | 1.0 | 0.5 | 1.0 | 1 | 0 | 2.0 | 50.0% | 2.9% | 0.05 | |
| 25 |
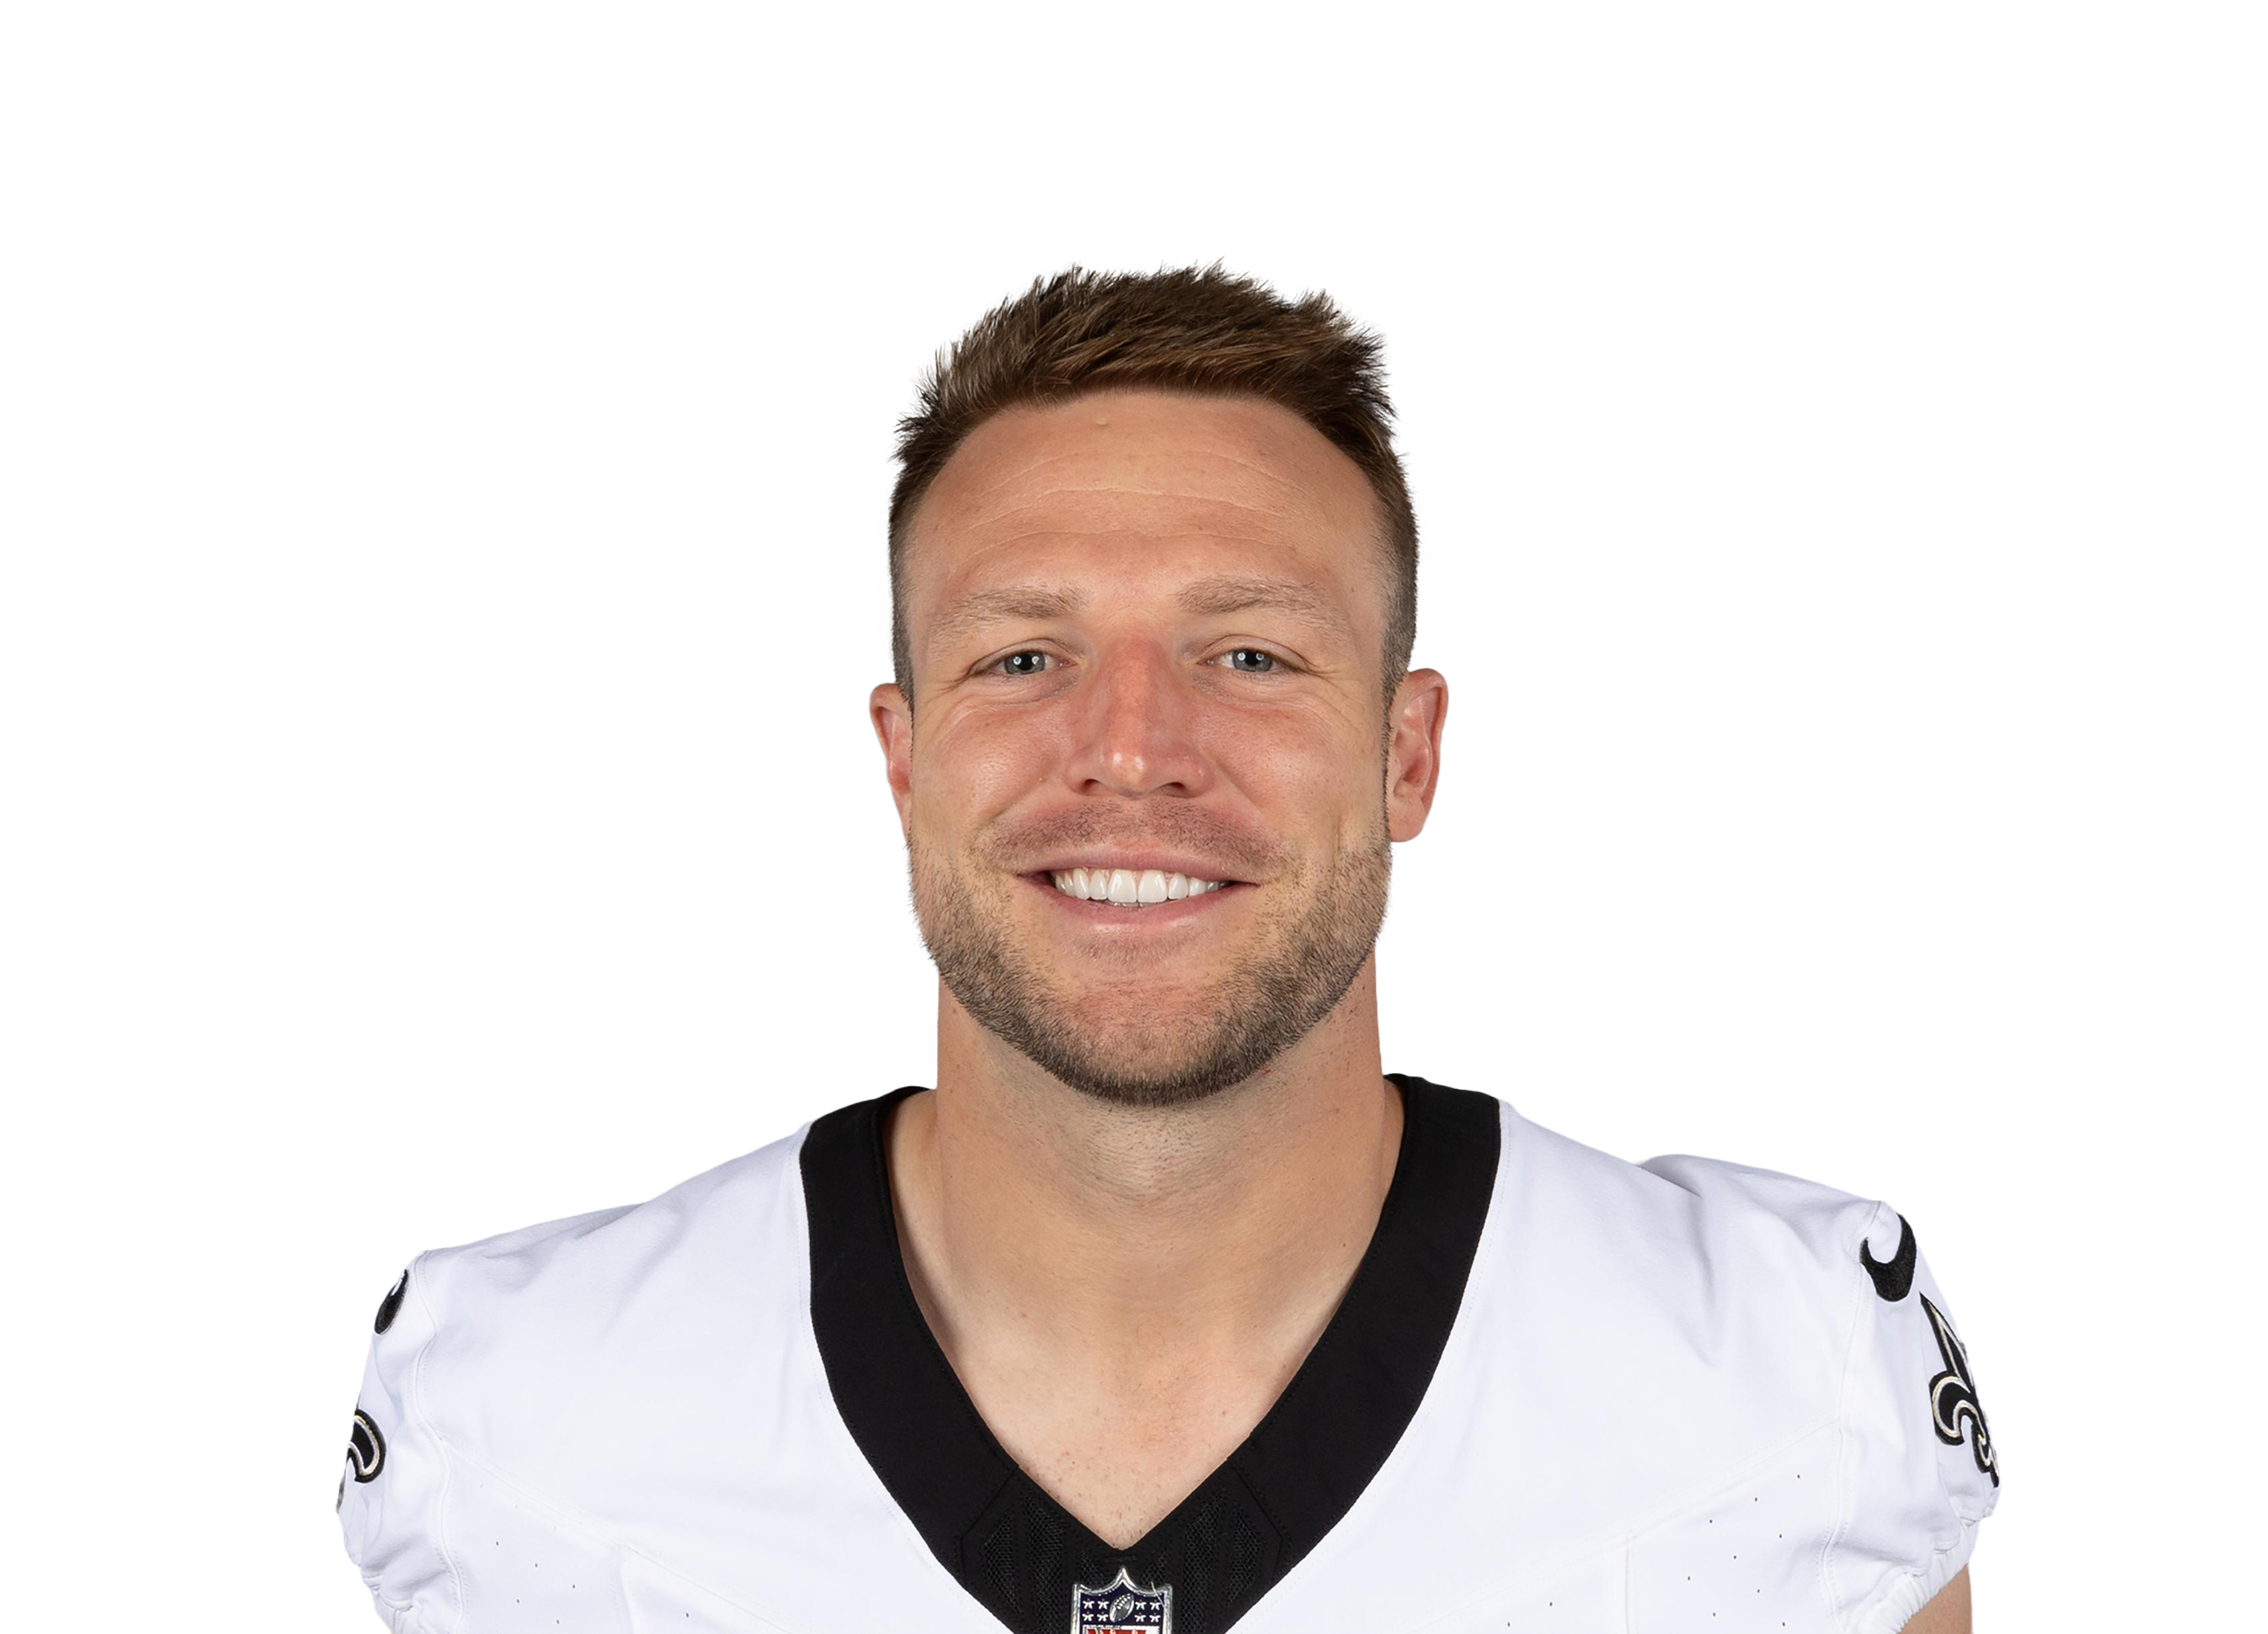 Taysom Hill
|
NO | 2 | 1.0 | 0.5 | 1.0 | 1 | 1 | 2.0 | 50.0% | 2.6% | 0.08 | |
| 26 |
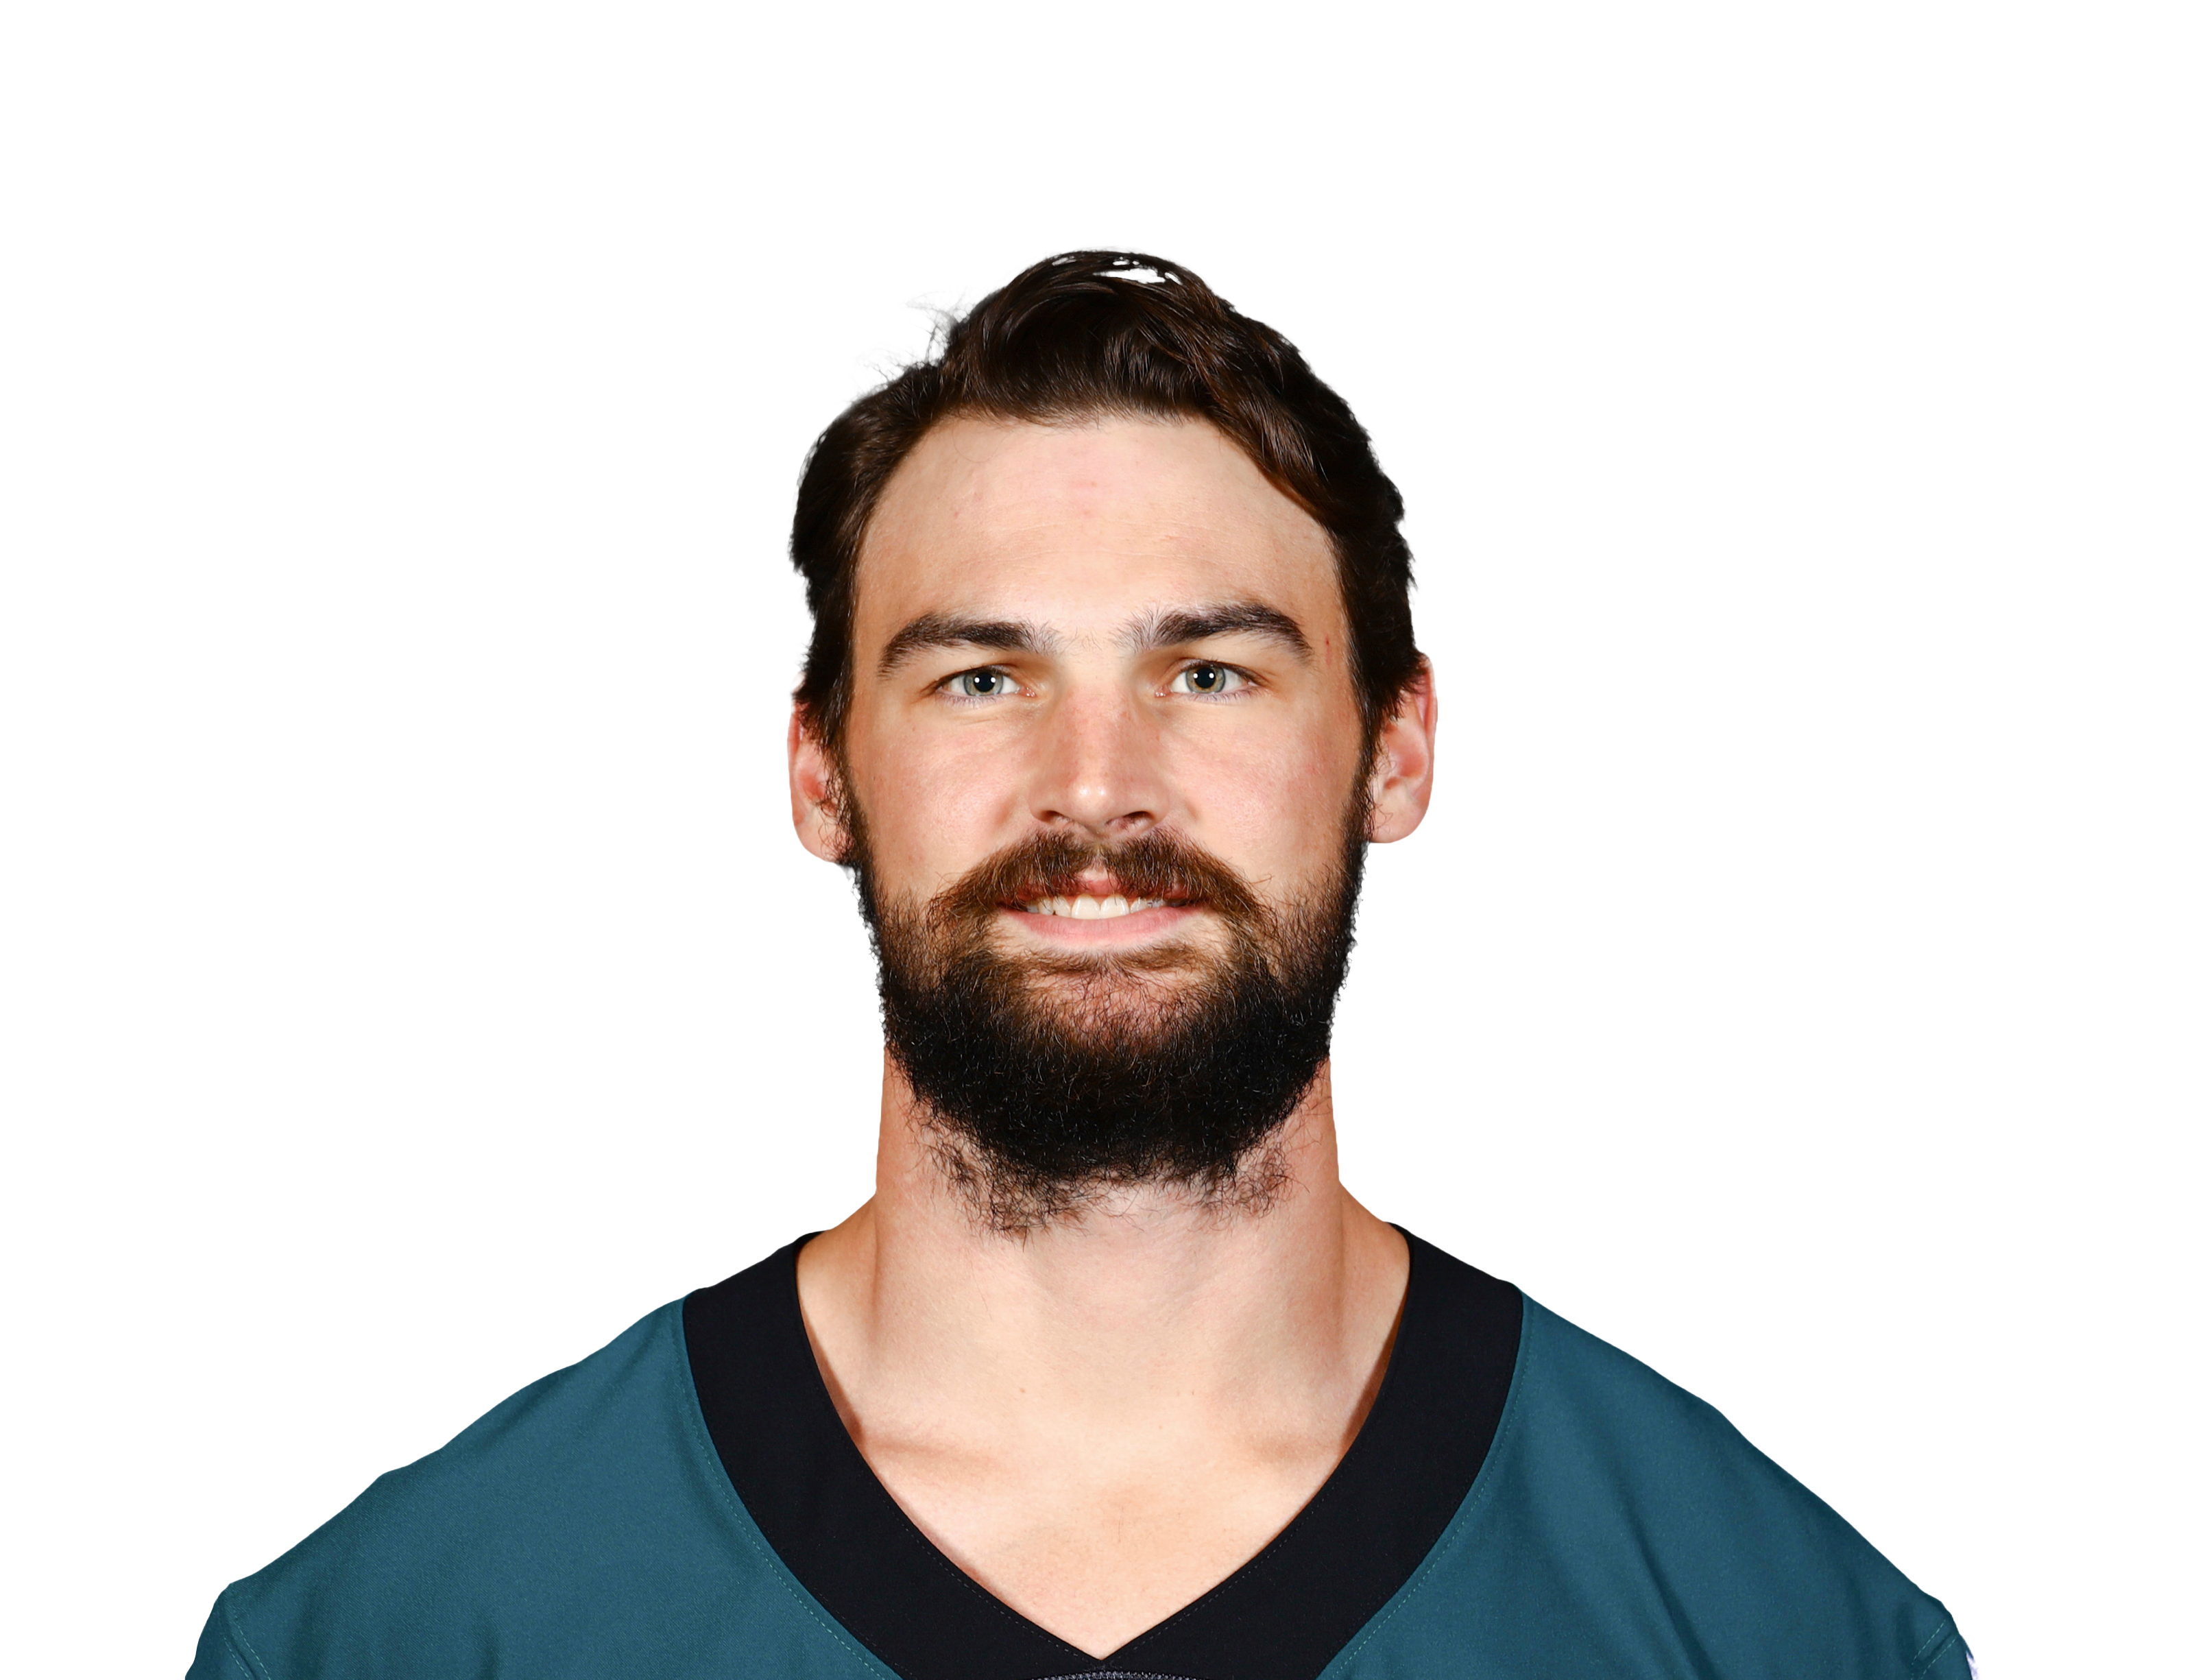 Dan Arnold
|
NO | 1 | 0.0 | 0.0 | 2.0 | 0 | 0 | — | 0.0% | 5.1% | 0.18 | |
| 27 |
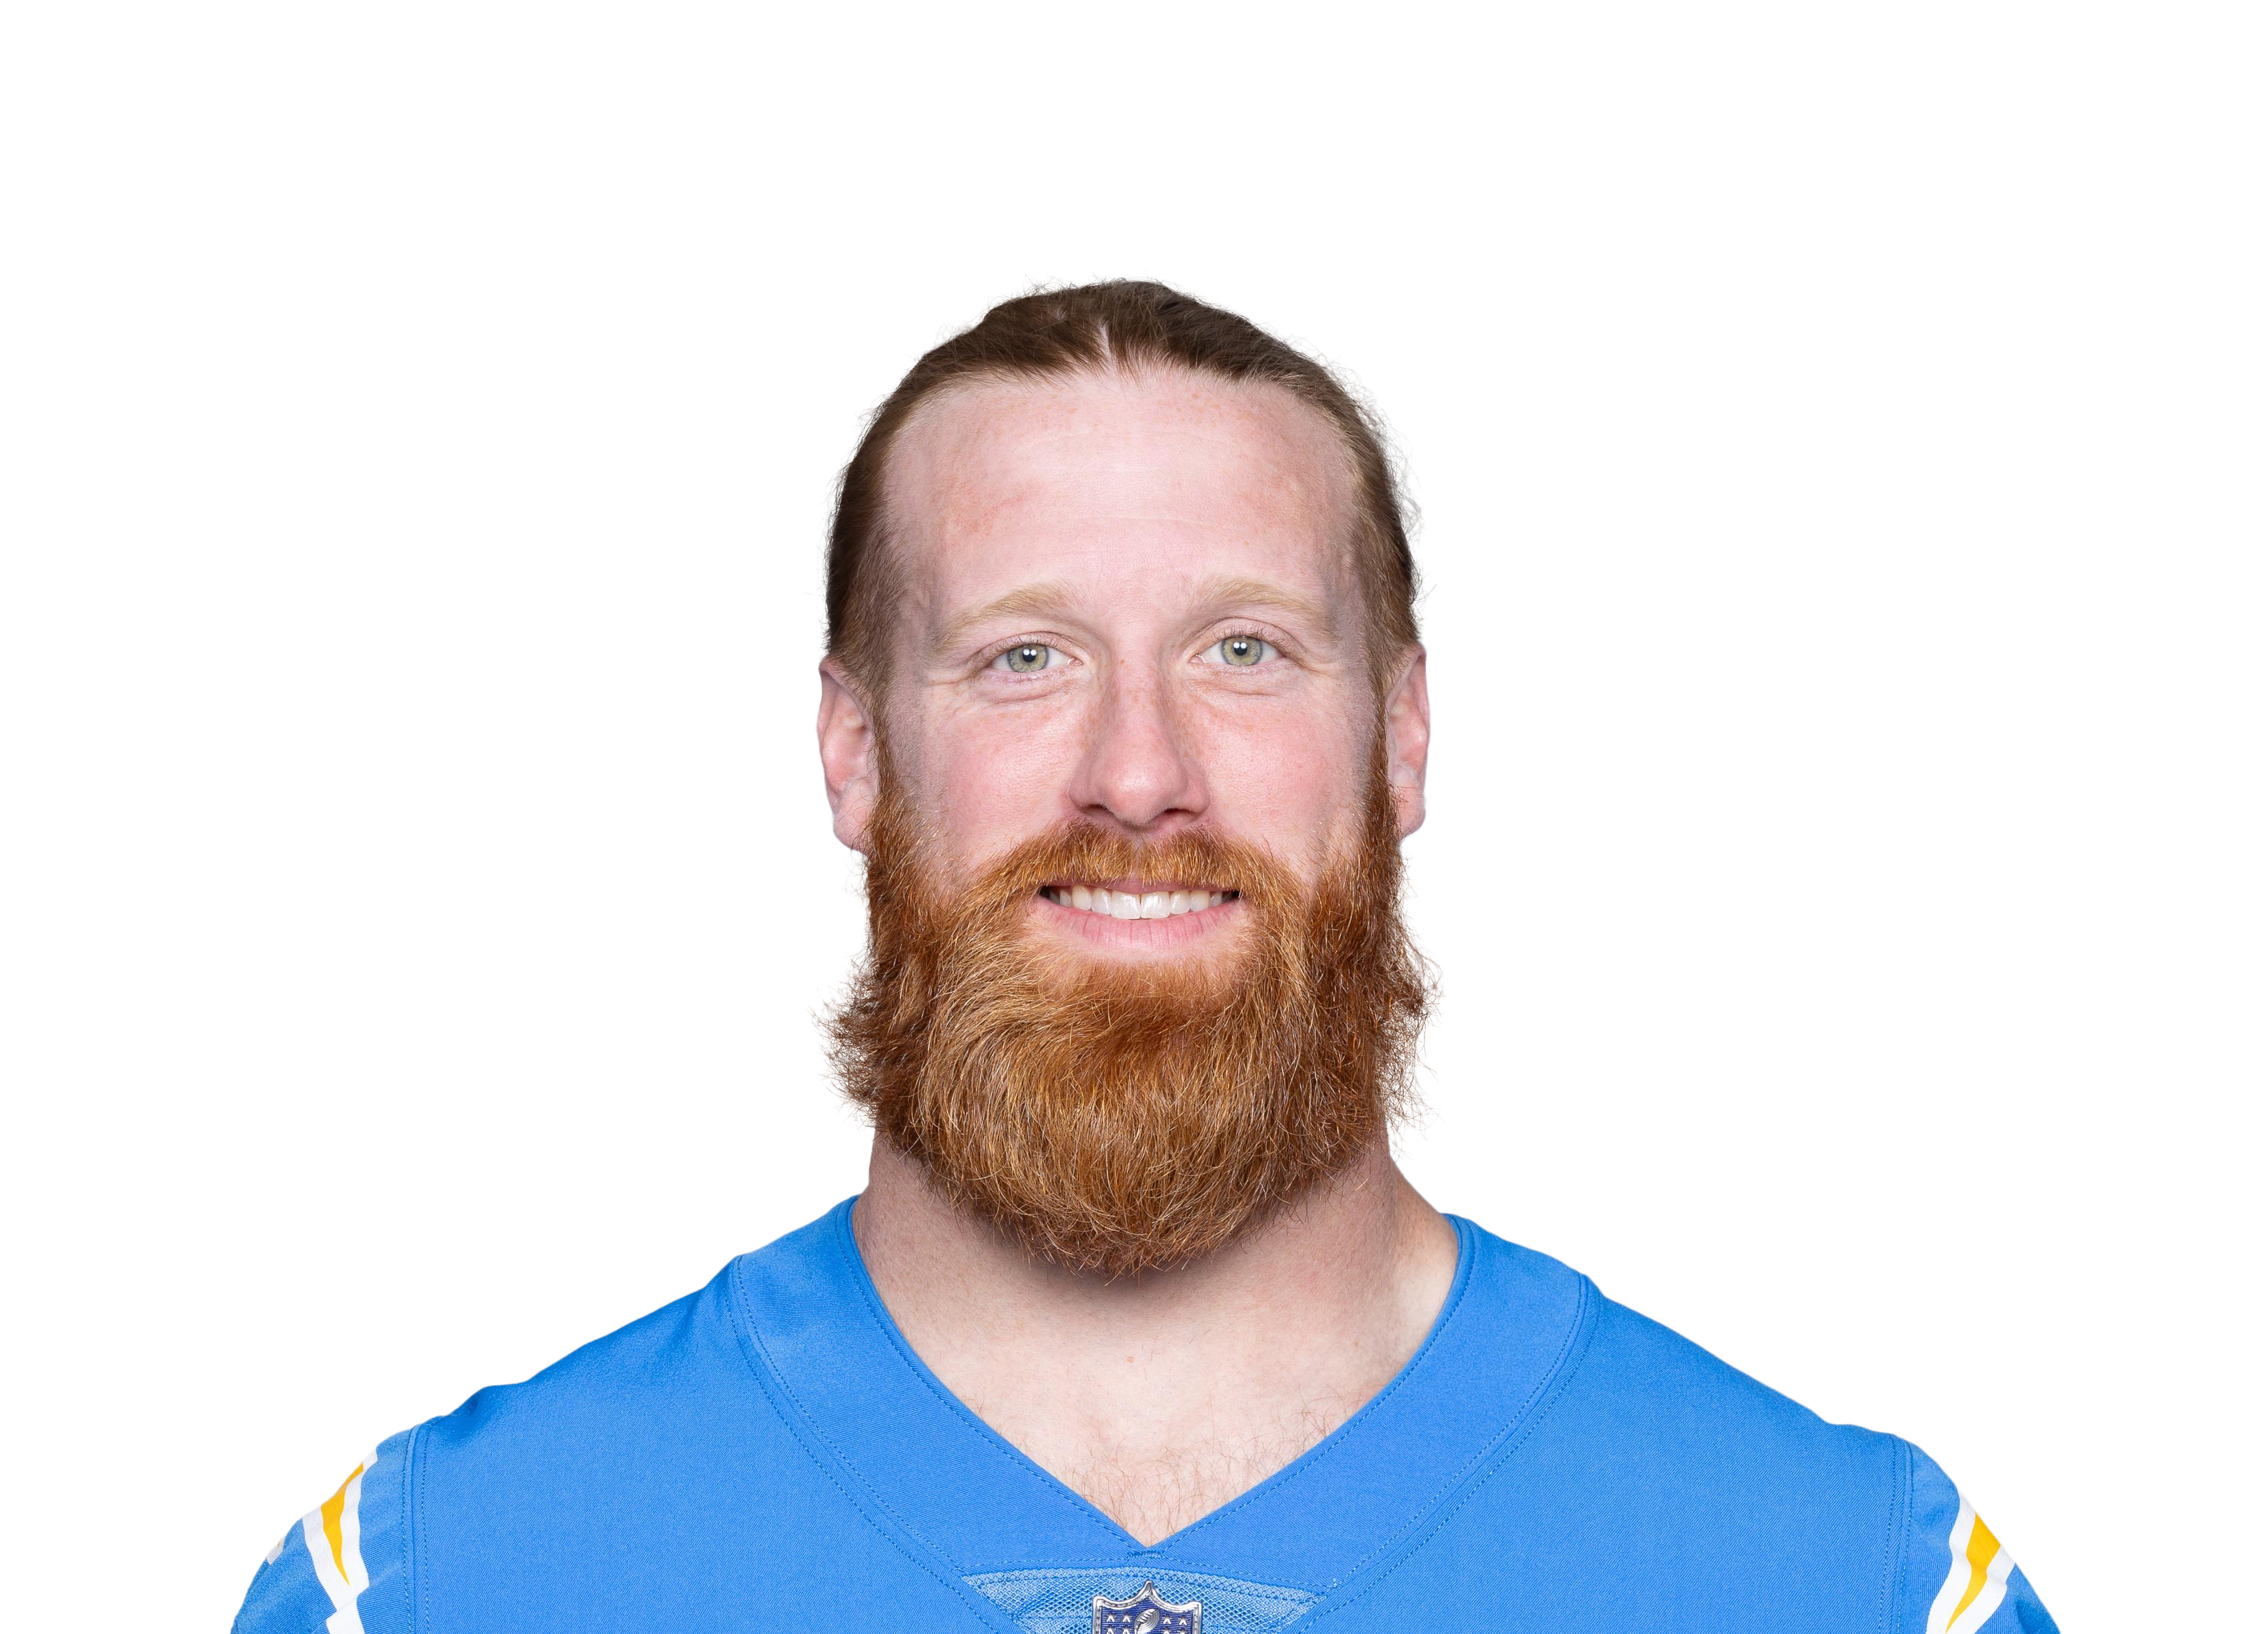 Hayden Hurst
|
BAL | 1 | 0.0 | 0.0 | 1.0 | 0 | 0 | — | 0.0% | 3.8% | 0.09 | |
| 28 |
 Ryan Hewitt
|
IND | 1 | 0.0 | 0.0 | 1.0 | 0 | 0 | — | 0.0% | 2.8% | 0.04 | |
| 29 |
 Rico Gathers
|
DAL | 1 | 0.0 | 0.0 | 1.0 | 0 | 0 | — | 0.0% | 3.1% | 0.05 | |
| 30 |
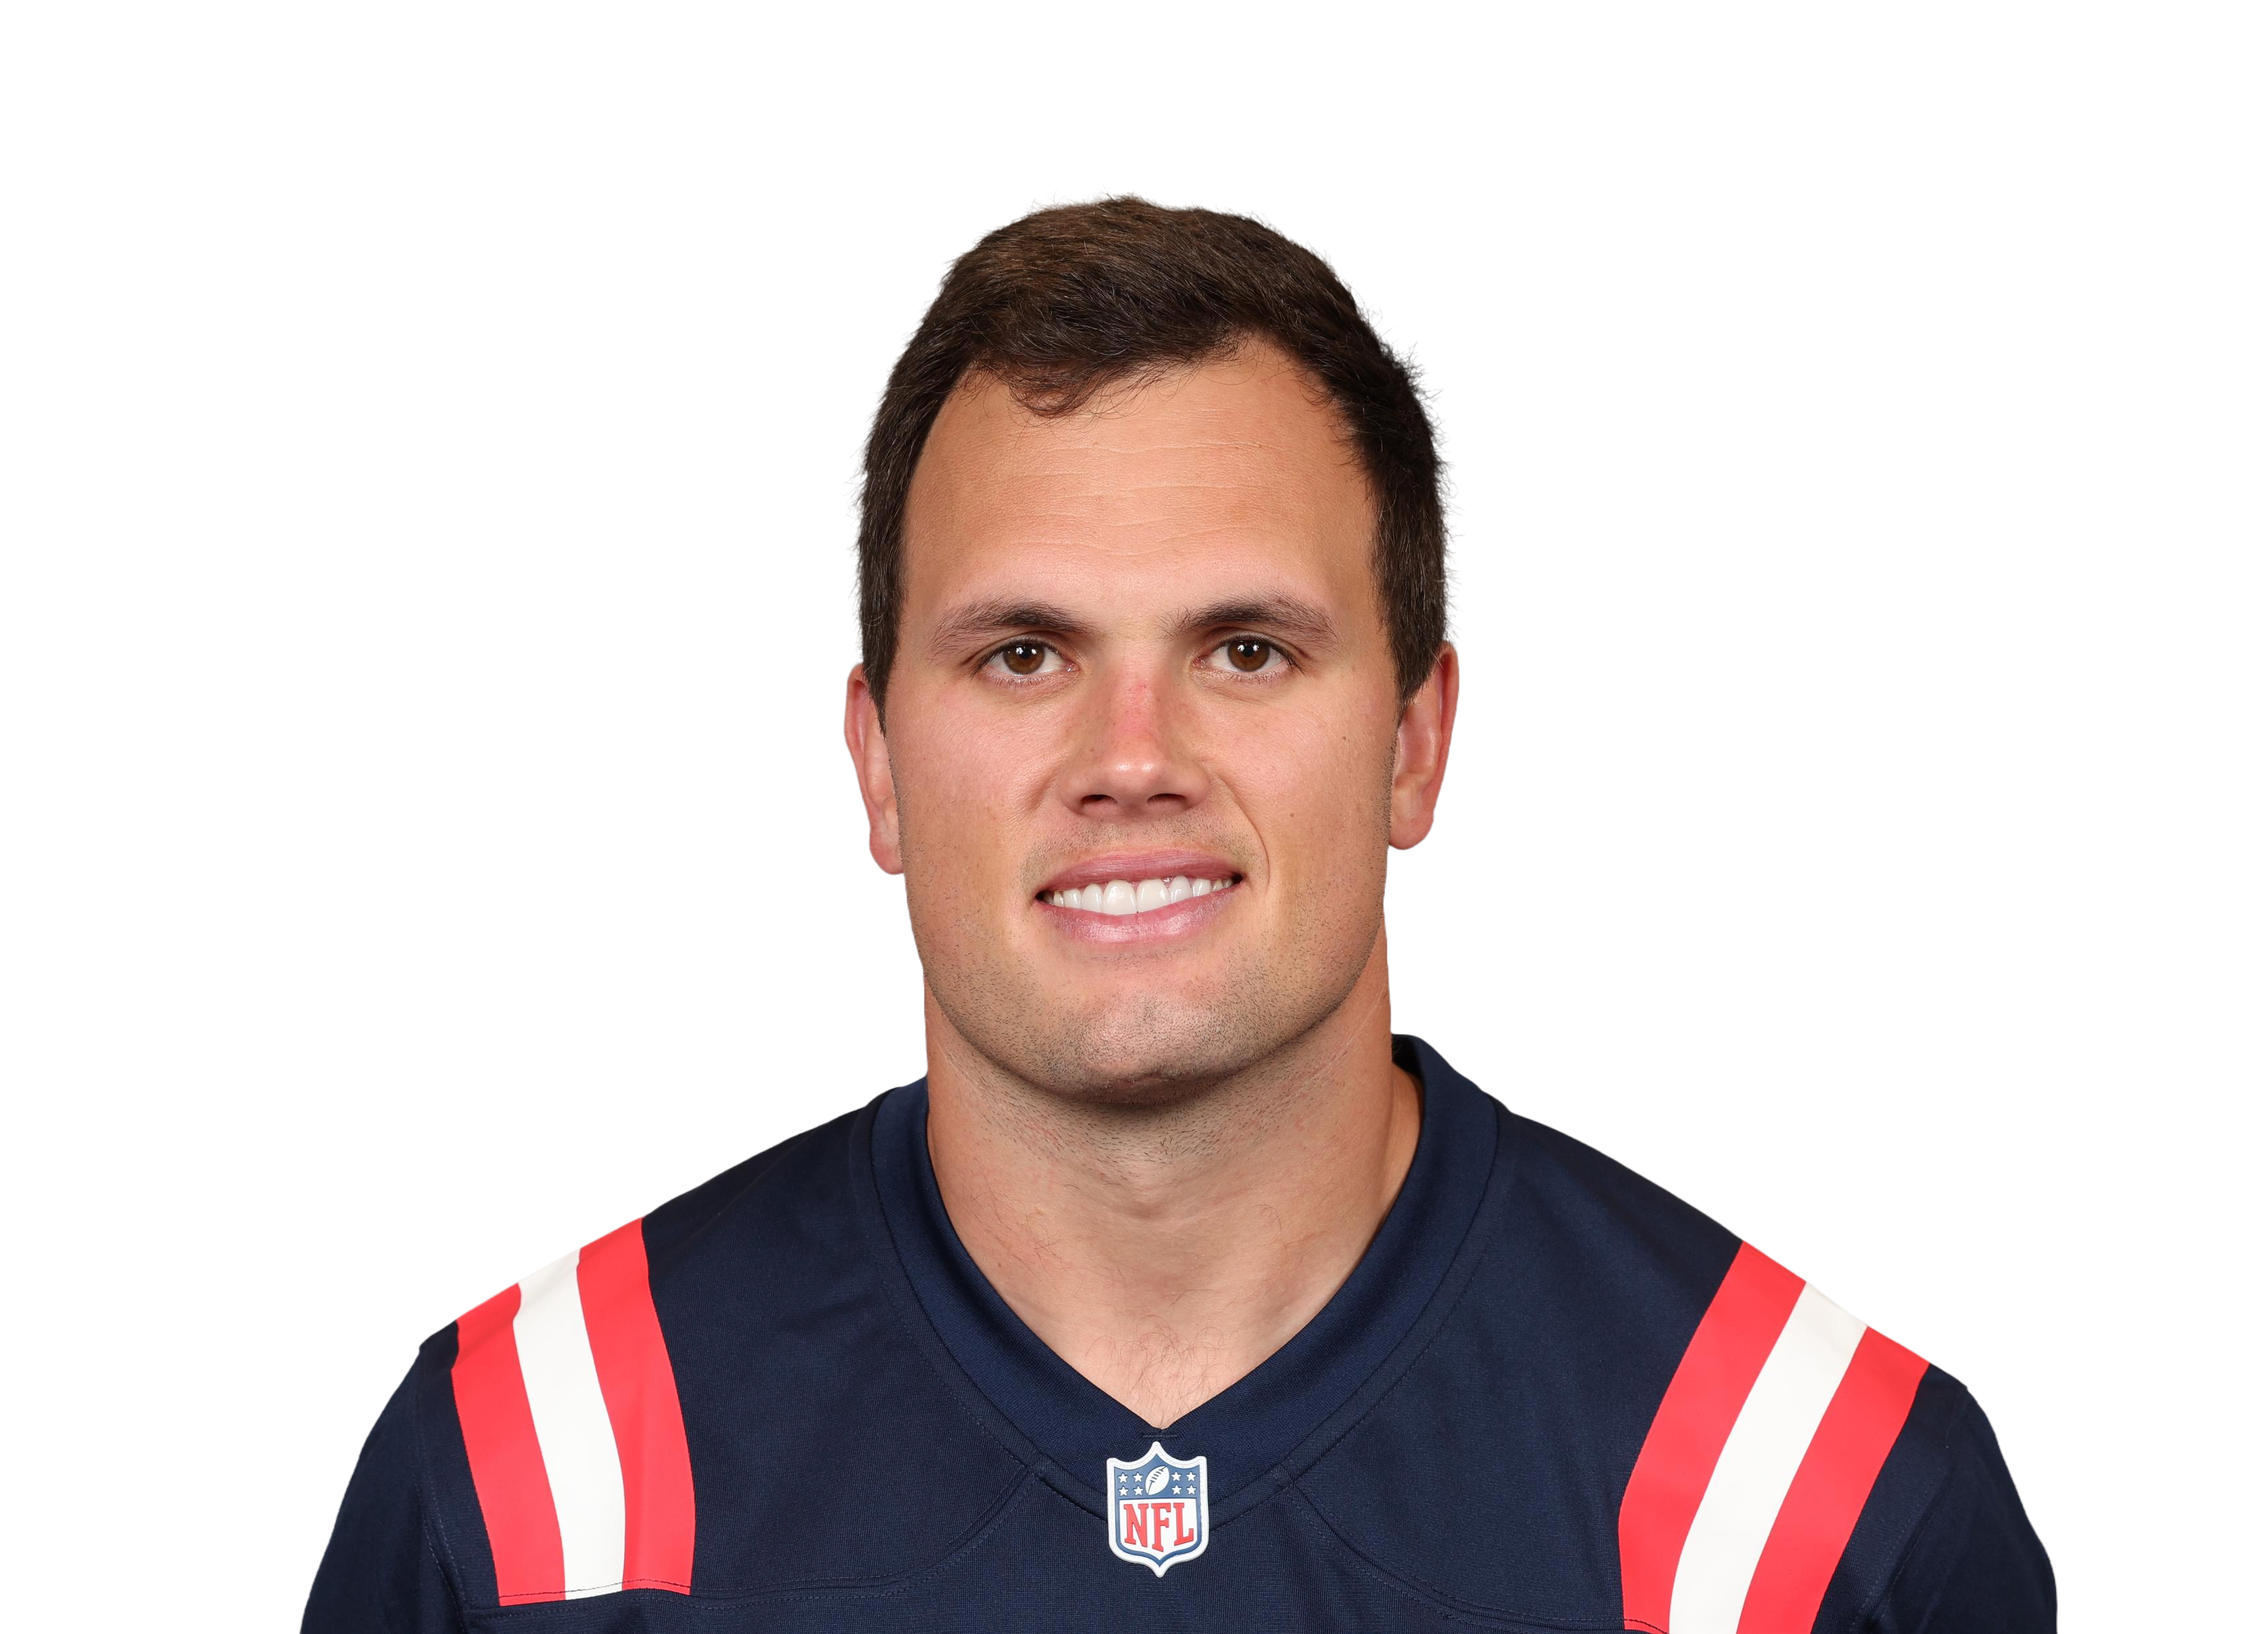 Hunter Henry
|
LAC | 1 | 0.0 | 0.0 | 1.0 | 0 | 0 | — | 0.0% | 2.1% | 0.06 | |
| 31 |
 Mo Alie-Cox
|
IND | 1 | 0.0 | 0.0 | 1.0 | 0 | 0 | — | 0.0% | 2.8% | 0.05 | |
| 32 |
 Johnny Mundt
|
LAR | 1 | 0.0 | 0.0 | 0.0 | 0 | 0 | — | — | 0.0% | 0.00 |
What this is. Finished box-score production from 2018, ranked by Rec yards. Per-game columns divide by games played, not games on the schedule, so a player who missed time is measured on the games he was in — and his season totals still show the games he missed. Minimum 1 games to be ranked, otherwise one big afternoon tops every list.
What it isn’t. None of this is a projection, a pick, or a prop recommendation — it is what already happened. Last season’s rate is a starting point for what a player does in a game, not a forecast of the next one: offense, role, and health all move underneath it. Target share and WOPR describe a player’s share of his own team’s passing game, so they compare roles, not players across teams.
Regular season and postseason are kept separate on purpose. Playoff samples are small and the opponents are better; blending them into a season rate quietly flatters the players who got there. The grade is regular-season only, so it is not offered on the postseason split.